Watershed Analysis
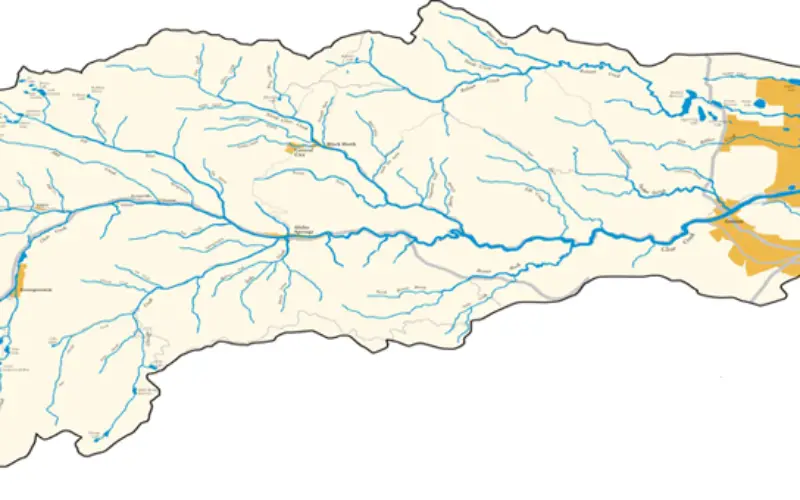
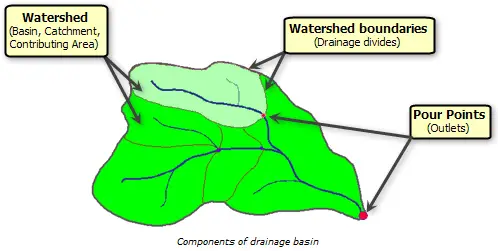
A watershed is the area of land where all of the water that falls in it and drains off of it goes into the same place or common outlet. A watershed is also defined by topographic divides between two or more adjacent catchment basins, such as a ridge or a crest.
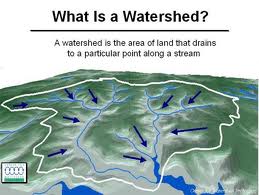
In simple words watershed is a region of land within which water flows down into a specified body, such as a river, lake, sea, or ocean; a drainage basin. The word watershed is sometimes used interchangeably with drainage basin or catchment. Ridges and hills that separate two watersheds are called the drainage divide.
Watershed analysis refers to the process of using DEM and raster data operations to delineate watersheds and to derive features such as streams, stream network, catchment areas, basin etc.
Traditionally, watershed boundaries are drawn manually onto a topographic map. The person who draws the boundaries uses topographic features on the map to determine where a divide is located. But with introduction of computers things become much easier. Now, one can generate preliminary watershed boundaries in a fraction of the time needed for the traditional method.
Delineation of watersheds can take place at different spatial scales. A large watershed may cover an entire stream system and, within the watershed, there may be smaller watersheds, one for each tributary in the stream system. Watersheds can be as small as a footprint or large enough to encompass all the land that drains water into rivers that drain into Bay or sea or ocean.
Components of Watershed
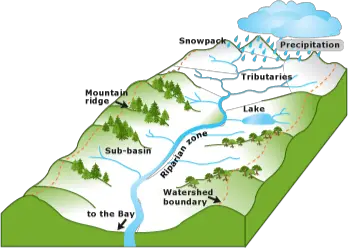
Broadly a watershed have five components: watershed boundary, Subbasin, Drainage divides, Stream network, Outlets (pour points).
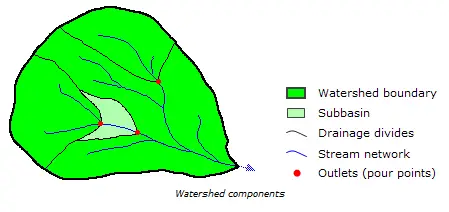
Courtesy: ESRI
Subbasin : Larger watershed and can also contain smaller watersheds, called subbasins.
Drainage divides : The boundaries between watersheds are termed drainage divides.
Outlets : The outlet, or pour point, is the point on the surface at which water flows out of an area. It is the lowest point along the boundary of a watershed.
Courtesy: ESRI
Delineation of watershed can be divided into types and these are area based and point based.
An area based method divides a study area into a series of watershed, one for each stream section. Whereas, a point based method derives a watershed for each selected point. The selected point may be an outlet, a gauge station or a dam.
Steps Involved in Delineation of Watershed
When delineating watersheds or defining stream networks, we proceed through a series of steps. Following are the steps:

Some steps are required, while others are optional depending on the characteristics of the input data.
1. DEM Acquisition
The first input required for watershed analysis is DEM. Digital Elevation Models (DEMs) are a type of raster GIS layer. In a DEM, each cell of raster GIS layer has a value corresponding to its elevation (z-values at regularly spaced intervals). DEM data files contain the elevation of the terrain over a specified area, usually at a fixed grid interval over the “Bare Earth”.
DEM, Courtesy: ESRI
2. Fill
Fills sinks in a surface raster to remove small imperfections in the data. A filled DEM or elevation raster is void of depressions. A depression is a cell or cells in an elevation raster that are surrounded by higher elevation values, and thus represents an area of internal drainage. Although some depressions are real, such as quarries or glaciated potholes, may be imperfection in the DEM. Therefore, depression must be removed.
Fill DEM, Courtesy: ESRI
A common method to remove depression is to increase its cell value to the lowest overflow point out of the sink. This results in flat surface.
3. Flow Direction
A flow direction raster shows the direction water will flow out of each cell of a filled elevation raster. A widely used method for deriving flow direction is the D8 method, used by Arc GIS. In D8 method, assigns a cell’s flow direction to the one of its eight surrounding cell’s that has the steepest distance-weighted gradient.
Flow Direction, Courtesy: ESRI
D8 method produces good results in zone of convergent flows and along well defined valleys. It fails to represent adequately divergent flows over complex slopes and ridges.
Another algorithm is well used in calculation of flow direction is D ∞ (infinity).
Use the BASIN tool on the flow direction map to identify the basins that flow to each outlet point on the map edge. Use the Identify button to determine the value of the particular basin you want to analyze, and use the raster calculator to create a 0-1 raster map of just that one basin.
Basin, Courtesy: ESRI
Basin, Courtesy: ESRI
4. Flow Accumulation
A flow accumulation raster tabulates for each cell the number of cells that will flow to it. The tabulation is based on the flow direction raster.
Flow Accumulation, Courtesy: ESRI
A flow accumulation raster can be interpreted in two ways.
- Cells having accumulation values generally correspond to stream channels, where as cells having an accumulation value of zero generally corresponds to ridgelines.
- If multiplied by cell size, the accumulation value equals to drainage area.
5. Stream Network
Stream network can be derived from a flow accumulation raster. The derivation is based on a threshold accumulation value. A threshold value of 500, for example, means that each cell of the drainage network has a maximum of 500 contributing cells.
Stream Network, Courtesy: ESRI
Stream Order, Courtesy: ESRI
A higher threshold value will result in a less dense stream network and fewer internal watersheds than lower threshold value.
Threshold values between 100 to 500 cells seem to best capture the stream network in the area.
6. Stream Links
Assigning a unique value and associating with flow direction to each section of stream network is a step or procedure to derive stream links.
Stream Links, Courtesy: ESRI
A stream link raster therefore resembles a topology-based stream layer: the intersections or junctions are like arcs or reaches.
7. Area-wide Watersheds
This is final step to delineate watershed for each stream section. Inputs required for area-wide watershed delineation are flow direction raster and stream link raster. A denser stream network will have more but smaller watersheds.
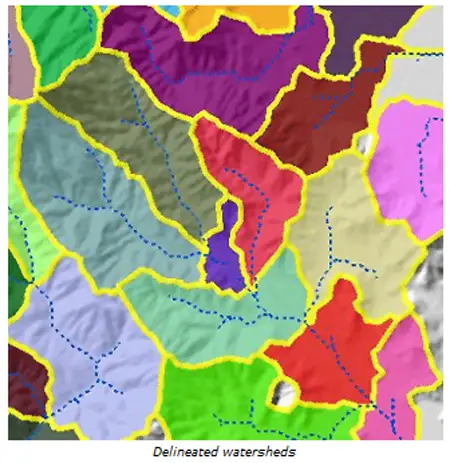
Delineated Watershed, Courtesy: ESRI
8. Point Based Watersheds
Delineation of individual watersheds based on point of intersection (pour point) follows the same procedure as for delineation of area-wide watersheds. The only difference is to substitute a point raster for a stream link raster.
Point based watersheds delineation is based on the point of interest. This point of interest may be stream gauge stations or dams. They may also correspond to surface drinking water system intake points of interest are called pour point or outlets.
If pour point is not located directly over a stream link, it will result in a small, incomplete watershed for the outlet.
Factor Influencing Watershed Analysis
There are two main factors which effects watershed analysis. These are as follows:
- DEM: A 30 meter DEM likely to be too coarse to provide detailed topographic features for geomorphic and hydrologic modeling.
- Algorithm: The choice of algorithm is another important factor in watershed analysis output.
Application of Watershed Analysis
Watershed analysis is used for the management and planning of natural resources.
- To provide necessary inputs for hydrological modeling.
- Flood prediction modeling and snow melt runoff models etc.
- Watershed analysis provides catchment boundaries but also hydrological parameters useful for management programs.


The content is really informative.It provided me a basic idea about the workflow.i am interested in using the data and use it practically so that i can learn it a better way.Please provide me the link where i can get the data and the detail tutorial that have been used in the steps described above
Uttam
Give some time, will try to provide a complete step by step methodology and data set to carry out your own exercise.Soon it will be available on GIS resources.
very informative , cant be better than this . thank u so much
please explain me how to get suitable location for creating small dam after getting watershed delineation .
Finding a suitable site for dam can be done using spatial analysis tool in Arc Info. In particular you need to do weighted overlay analysis.
How the idea of D8 was firstly used and why it very useful in watershed delineation