Minnesota Municipality Using GIS for Public Utilities Outage Management
In recent news by American City & County, Minnesota municipality is using GIS for efficient handling of public utility outages. A Minnesota based company “Rochester Public Utilities”, provides services to more than 47,000 power and 35,000 water customers. During a service interruption, Rochester Public Utilities system operators use an enterprise GIS program from Esri, to display geographical and tabular data relating to the outage.
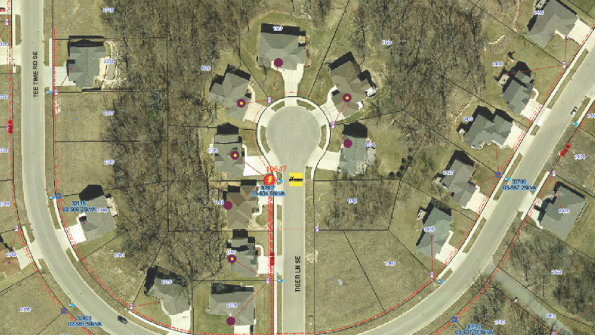
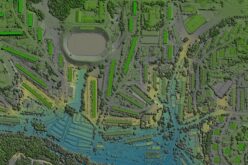
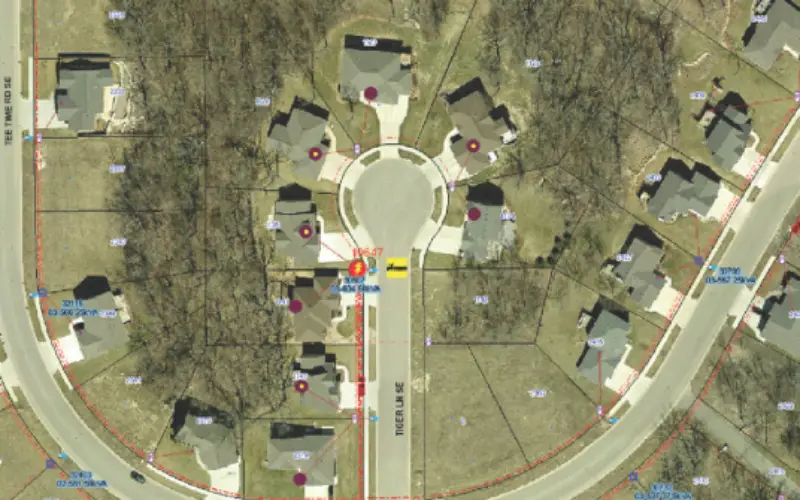
The image above shows a sample map with Networkfleet truck locations overlaid on ArcMap-generated maps. Underground utilities appear as red lines. The numbers are feeder IDs, and the lighter red lines are service lines. Using the Networkfleet application program interface, users can see where service vehicles are in relation to addresses.
Credit: American City & County
However, the information about the location of service trucks in the area is missing. The location of service truck could add faster response to the outage and begin repairs quicker.
Rochester Public Utilities have been already using Verizon Networkfleet’s GPS wireless fleet management system to track the location of certain trucks. Using the positional data from GPS and mapping on a web-based application program interface provides a relation to outages, for service truck location and to every customer.
A Visual Basic application, developed by Rochester Public Utilities, runs as a Windows service every two minutes, with no user interaction required. The Windows service reads the data returned in XML file format, writes it to a table, and then converts it to a text file on the server.
“Using ArcMap, we can see an aerial photograph of where the outage has occurred, along with the location of power lines, fuses, transformers, etc. in the affected area,” said Ryan Moore, GIS specialist at Rochester Public Utilities.