Utilizing Patch Metrics to Improve Classification of Remote Sensing Imagery
Classified remote sensing imagery is used to inform management of various natural resources, though achieving accurate results is a persistent challenge. In particular, some land cover types that are functionally very distinct can be spectrally similar, thus misclassification errors can yield poor decision-making. Relatively new, object-oriented classification methods that consider the shape of clusters of similar pixels can yield improved results, albeit often at considerable software expense and steep learning curves.
In a study by Michael L. Treglia et. al., have consider an approach to improve upon per-pixel classification techniques. The approach has a two-stage classification procedure, that takes advantage of free and open source tools to improve upon per-pixel classification techniques. First to perform supervised classification to obtain a layer with patches of our focal land cover classes. Then calculate descriptive metrics for each patch, characterizing size and shape, and for each land cover class we extract the per-pixel probability of class assignment. Lastly, perform a second supervised classification based on raster layers representing the aforementioned class probabilities and patch metrics.
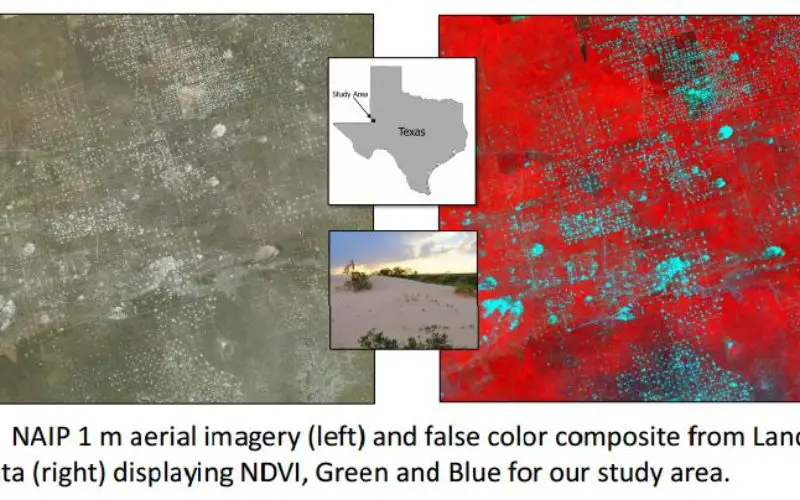
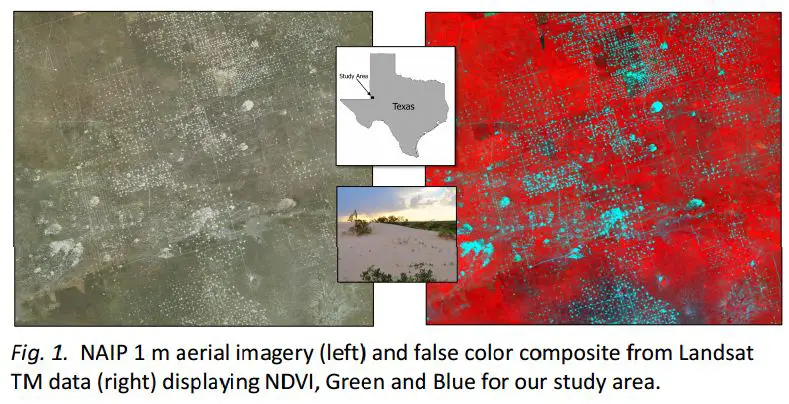
Study Area: Landscape of West Texas
Data Used: Landsat 5 TM data, available for large portions of the globe for up to 27 years, at 30 m resolution.
Methods
Stage 1 Classification
- Calculated NDVI and Tasseled Cap metrics for a single Landsat scene (Path 30/Row 38) from 2010 and stacked them with the original Landsat bands using QGIS and R.
- Performed supervised classification using Random Forests (in R), based on 260 training areas derived from 1 m aerial imagery and our knowledge of the system.
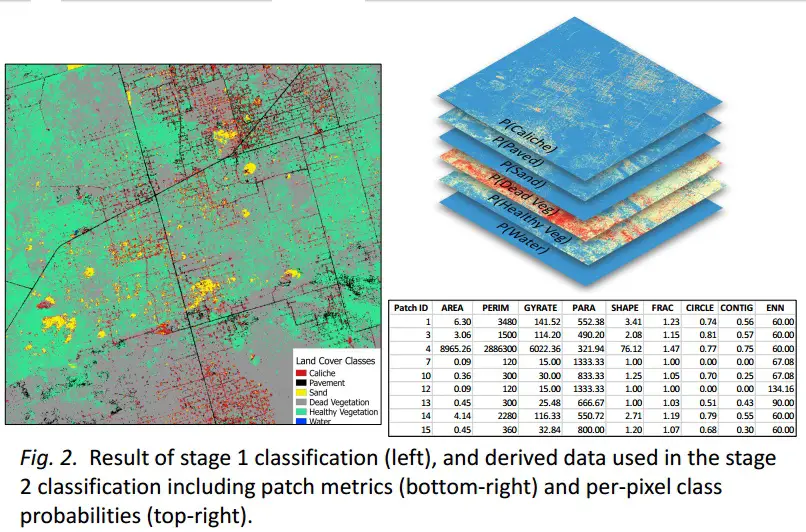
Stage 2 Classification
- Calculated metrics for each distinct land cover patch classified in stage 1, using Fragstats, and created raster layers for each metric.
- Created raster layers of class probabilities from the stage 1 classification for each land cover class.
- Performed supervised classification using Random Forests, on raster layers representing class probabilities and patch metrics.
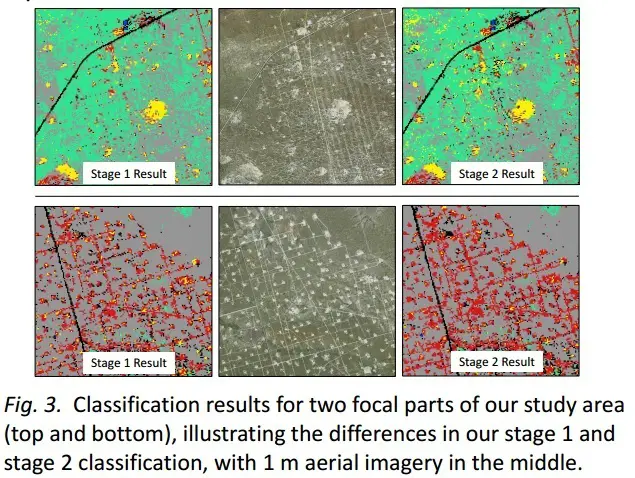
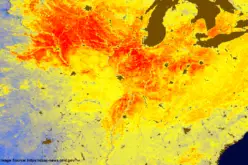
Results: Deriving patch statistics from a per-pixel classification for use in a second classification run provided some benefit in our system (Fig. 3). Though there are still classification errors after stage 2, caliche roads and well-pads are better distinguished from sand formations. The stage 2 classification increased overall accuracy on our training dataset, from 94% to 98%. Though these results are positive, neither classification performed well on a smaller evaluation dataset (~50% overall accuracy), with the greatest confusion between living and dead vegetation.
Conclusion: The two-stage approach for classifying remote sensing imagery effectively uses information about clusters of similar pixels to improve results. It is conceptually simple, and was done exclusively using freely available tools. The example presented here is a first attempt at this method, involving a complex landscape with fine-scale features, perhaps difficult to detect using Landsat imagery. Thus, we suspect this technique will yield greater benefit in landscapes with larger features, or using higher-resolution imagery