John Nelson has created “A Breathing Earth,” a series of animated GIFs made from NASA’s cloud-free satellite imagery of the Earth that show the oscillations of snow and greenery as the seasons change.
John Nelson has given us a new vision of this familiar cycle in the form of a simple GIF… but the result is mesmerizing for its profound demonstration of these cycles upon our lives and the world processes it clearly illustrates.
Nelson, who is more often associated with extremely complex visualizations of weather patterns, used cloudless imagery from the
What we see as a result, is seriously hypnotizing. The Earth’s seasonal heartbeat on display as never before. The northern hemisphere’s massive snowpack as it rolls into winter and the vegetation of the world drying and greening as the seasons pass.
Nelson calls his animation The Breathing Earth, and it’s a very apt title. Each year as these cycles progress the CO2 levels of the Earth similarly go up and down. This is because the Earth’s vegetation is not equally influenced by winter and summer cycles happening simultaneously in the northern and southern hemispheres. As a result, the north’s vegetation filters far more CO2 and produces far more oxygen in the summer, and during the long, snowy winter this is significantly less. In contrast, the southern hemisphere has little snow, many thick jungles, and provides much of the world’s valuable air filtration. This can be clearly seen on CO2 level graphs. Among some of the other things Nelson finds fascination about his project.
Courtesy John Nelson
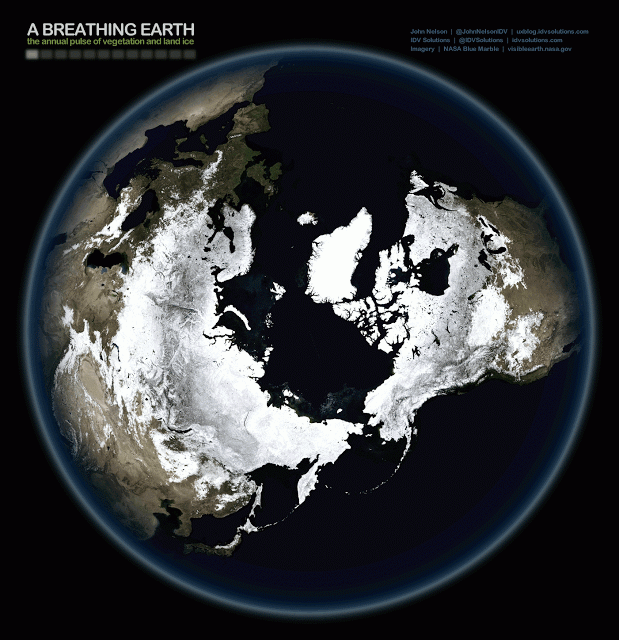
The first GIF is taken from a perspective looking down on the planet, with the North Pole directly in the center. White frost radiates out from the top of the globe and creeps south in all directions. It travels through Siberia, Canada, and northern Europe, heading towards the equator located around the circle’s edge, but ends before the top of Africa. The Mediterranean Sea is the visible body of water on the top left hand side, and the Great Lakes make up a small network of dark blue shapes on the land mass to the right.
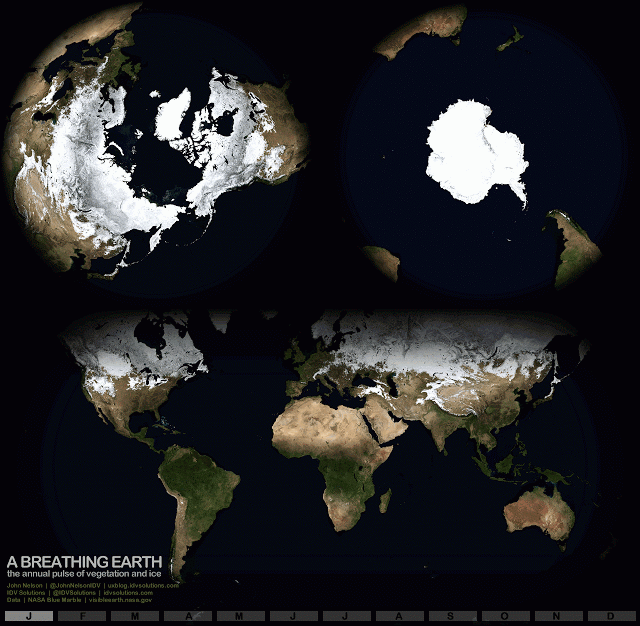
Nelson also animated a complete map to make sure people can see all reaches of the temperate planet. Beyond the expanding and shrinking ice cover, the annual push and pull of the green wet season and brown dry season are striking—particularly on the African savannah and the coastal areas of Australia.
“These GIFS represent the power of data visualization to translate natural phenomena into a format where users can think about information as more than just a muddle of numbers.”