VRMesh V9.5 Available with New Advanced Features for LiDAR Strip Adjustment
Oct. 12th, 2017 – VirtualGrid is pleased to announce the availability of VRMesh v9.5, the latest version of its powerful 3D point cloud and mesh processing software. This new release provides a simple and fast way for LiDAR strip adjustment with high accuracy. It adds a new feature to separate overlapping LiDAR strips, redesigns and speeds up global registration over 10 times faster, and also allows you to generate a PDF report for viewing the quality of registration.
The complete workflow of strip adjustment includes:
Step 1: Separate overlapping LiDAR strips based on the selected trajectories
Step 2: (Optional) Automatically classify vegetation in each strip to get a clean surface
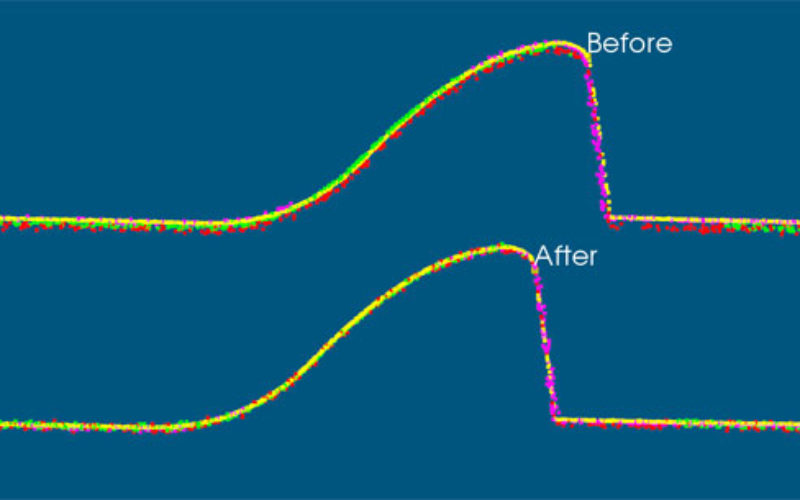
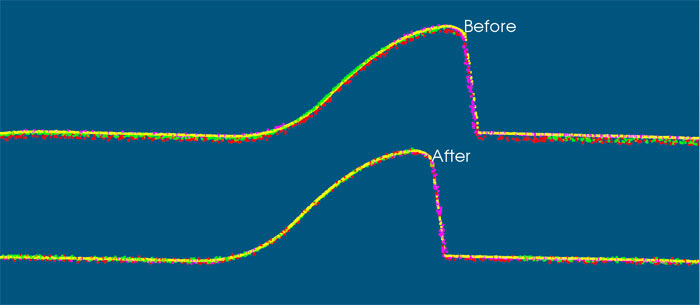
Step 3: Run global registration to fix the misalignment between the laser scanner and the inertial measurement unit (IMU)
The unique classification features in VRMesh can easily identify some noisy objects on the surface, e.g. vegetation, in each LiDAR strip to prevent these noises from disturbing strip adjustment. The global registration method works well for unstructured point clouds. With these cutting-edge technologies, VRMesh provides a flexible and accurate strip adjustment solution for both airborne and mobile LiDAR data. VRMesh is truly an industry-leading software product that maximizes productivity and reduces overhead costs.
New Features:
- Separate LiDAR Strips command (in the Registration menu): separates overlapping LiDAR strips (time-stamped laser points) into different LAS files based on the selected trajectories.
- Count Regions command (in the Analyze menu): counts the number of regions within a given range of points.
- Triangle to Quad command (in the NURBS menu): transforms a selected object from triangle meshes to quad meshes.
- Export to PDF: enables you to generate a 2D pdf report.
- Import/Export Formats: add *.csv, *.x3d
Enhanced Features:
- Global Registration command (in the Registration menu): is redesigned and speeded up over 10 times, and allows you to generate a PDF report for comparing the mean and stand deviation before and after registration.
- Measure Deviation command (in the Analyze menu): adds a chart window to show the measurement result at each cross-section, and allows you to add charts to a PDF report.
- Change Class command (in the Classification menu): enables you to reclassify a region within a defined size.
- Pipe along Curve command (in the Mesh Editing menu): enables you to create a rectangular pipe besides a circular pipe.
- Some bugs are fixed.