Esri has released Esri ArcGIS 10.5 on December 19, the next-generation analytics technology includes the latest release of Esri’s enterprise GIS and unlocks the full potential of your data.
Esri ArcGIS 10.5 arrives at a time when organizations worldwide are challenged to make sense of real-time digital information. The release helps them glean insight from enterprise data, big data, and the Internet of Things and share that insight in intuitive ways.
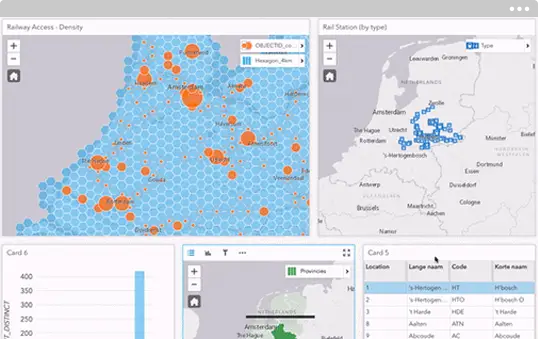
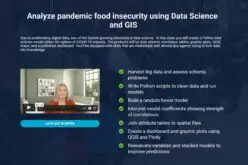
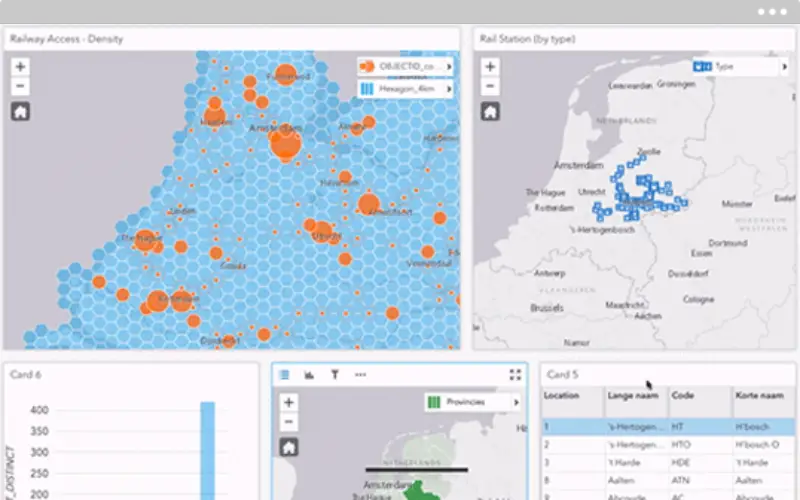
Interactive Data Exploration. credit: Esri
The new release is powered by Esri ArcGIS Enterprise, a significant evolution of the technology formerly known as ArcGIS for Server. ArcGIS Enterprise has been updated to meet the needs of today’s information-dependent organization, with improved power to process and analyze large, disparate datasets. Data that once required hours of processing can now be analyzed in minutes, delivering quick insight from billions of data records.
The new release of Esri ArcGIS 10.5 includes:
- Interactive Data Exploration
- Accelerated Analytics with Distributed Computing
- Real-Time Data and the Internet of Things
- Esri Demographics and Business Data in Your Enterpise
- Improved capabilities for handling large-scale analytics and big data.
- A drag-and-drop interface that streamlines the creation of spatial analysis through maps, charts, and graphs.
- Collaboration features to connect and analyze information across the enterprise.
- Improved integration of social media feeds, allowing users to integrate Facebook and Google accounts using their own logins.
- Ready-to-build, sharable solutions for raster, vector, and tabular data.
- Streamlined deployment to leading cloud providers, including Microsoft Azure, Amazon Web Services, and IBM Cloud.
- Enhancements to Esri ArcGIS Pro and Esri ArcGIS Online—including batch-analytic toolsets, vector tile basemaps, and code-free app building—that bring 3D data from drones and unmanned aerial vehicle (UAVs) to mobile devices.
Another prominent feature of ArcGIS 10.5 is Esri Insights, a drag-and-drop interface that streamlines spatial analysis of geographic and enterprise data through intuitive maps, charts, and graphs. In addition, enhanced collaboration tools allow users to break down siloes and deliver insight across departments and agencies.
Please visit for more information.