About Author: Kabir Uddin, Research Fellow, Geospatial Analytics for Disasters & Ecosystems, at United Nations University Institute for Water, Environment and Health (UNU-INWEH) // GIS Specialist, Annandale, Virginia, USA, email: kabir.uddin@unu.edu //kabir.uddin.bd@gmail.com
Nepal’s mountain landscape is uniquely beautiful. In the last couple of years, flooding has occurred in several locations, causing property damage and loss of life. Mapping floods is an urgent need for Nepal and difficult to read from a flat map alone. Flood mapping in Kathmandu, the high mountain community of Thame, and the Rasuwa river corridor shows how different geospatial views answer different questions. A two-dimensional inundation map establishes the regional pattern. Before-and-after satellite imagery reveals rapid landscape change. A three-dimensional ArcGIS Pro scene then places flood extent and buildings within the terrain, creating a virtual landscape that decision-makers and nontechnical users can explore and understand.
Main finding. Geospatial analysis was conducted for the Kathmandu and Thame floods. The 2026 flood in Rasuwa-Bhotekoshi identified 7,197 buildings within or intersecting the mapped flood-affected area across the assessed corridor and visualized them in ArcGIS 3D. The 3D visualization maps are easy to understand and indicate potential exposure, not field-verified damage, for every structure that any kind of reader interested in Nepal floods might be interested in.
Kathmandu Valley flood mapping in 2024
The September 2024 flood in the Kathmandu Valley illustrates the value of combining a regional inundation map with satellite imagery, field photographs, and three-dimensional views. The map shows flood-inundated areas across Bagmati Province, while the accompanying panels document conditions at locations including Balkhu and Bhaisepati. Together, these perspectives connect the mapped flood footprint with recognizable places, buildings, and observed ground conditions.
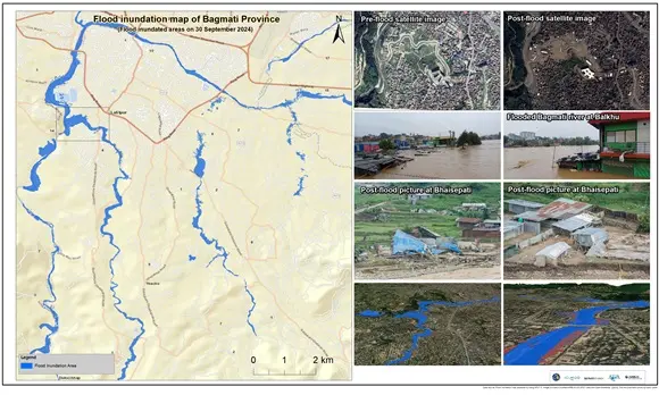
For urban flood communication, this multi-view approach is especially effective. The regional map provides context; the satellite comparison shows where conditions changed; photographs provide human-scale evidence; and the 3D perspective helps viewers understand how water occupied the built environment. ArcGIS Pro can organize these sources into a consistent analytical and communication workflow for emergency response and recovery planning.
Thame flood mapping in 2024
The August 2024 Thame flood demonstrates a different challenge. In a remote high-mountain environment, field access can be difficult, and the affected landscape can change within hours. Satellite images acquired before and after the event provide an immediate means of comparing the river corridor and identifying the expanded area affected by floodwaters and deposited material.
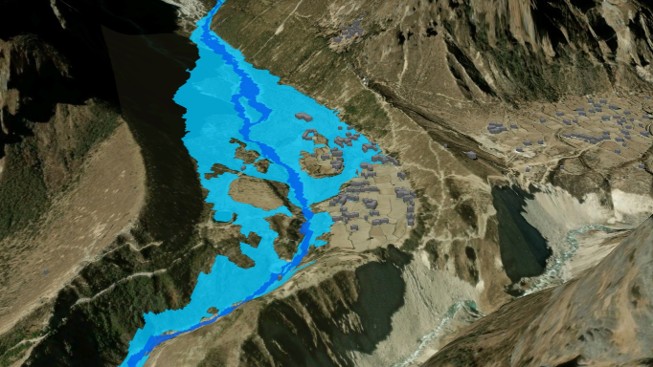
This comparison turns satellite change detection into an operational map. Analysts can trace the enlarged flow path, examine the relationship between the inundated area and settlement features, and identify locations for follow-up assessment. When these results are brought into ArcGIS Pro, terrain, imagery, buildings, trails, and flood boundaries can be explored together as a virtual field environment before teams reach the site.
Seeing the Rasuwa flood as a landscape
The Rasuwa flood unfolded through a steep Himalayan river system where narrow valleys, settlement clusters, roads, slopes, and river channels are tightly connected. In such terrain, a two-dimensional flood polygon can show where inundation occurred, but it does not always explain why exposure is concentrated in particular places. A three-dimensional scene adds vertical context.
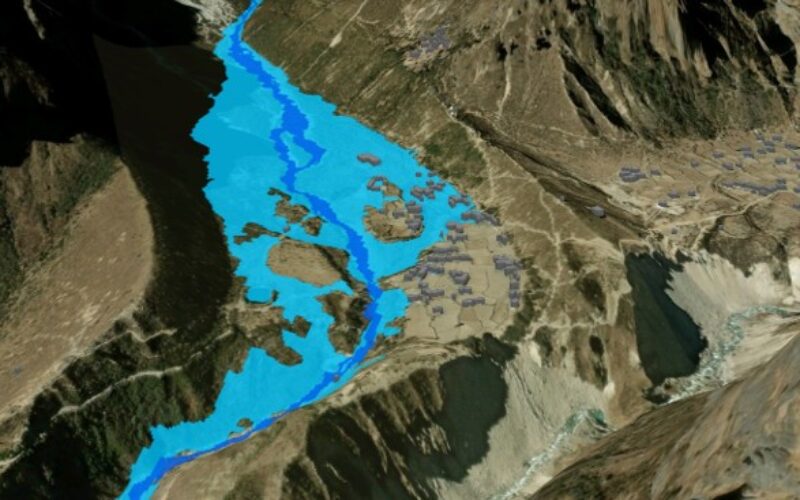
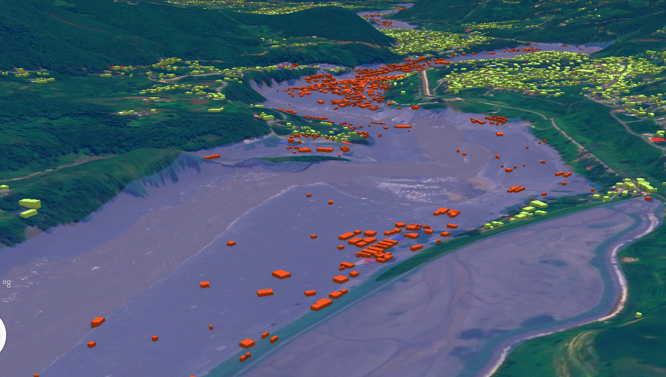
Using ArcGIS Pro, the flood extent was draped over the terrain and viewed together with satellite imagery and extruded building footprints. Buildings intersecting the mapped flood extent were symbolized in red; buildings outside it were symbolized in green. The result is an intuitive view of how settlements occupy the valley floor, riverbanks, terraces, and adjacent slopes.
Why the 3D view matters
The figure shows more than the distribution of red and green buildings. It reveals how the mapped flood occupies a broad valley floor, how exposed structures follow the river corridor, and how other settlements extend onto higher ground. The viewing angle makes the spatial relationship between terrain, channel form, flood extent, roads, and buildings immediately recognizable.
This is particularly useful in mountainous regions. A building may appear close to a river in plain view but stand on a higher terrace; another may seem nearby yet sit directly within a low-lying flow path. Elevation and perspective help users distinguish these situations and identify locations requiring closer investigation.
A virtual field environment in ArcGIS Pro
ArcGIS Pro 3D can function as a virtual field environment for preliminary assessment. Users can rotate the scene, tilt the camera, move along the valley, zoom from a regional overview to individual settlement clusters, and examine the landscape from upstream and downstream perspectives. These capabilities allow an analyst to explore terrain relationships before a field team enters an affected area.
This virtual reconnaissance is especially valuable when roads are blocked, weather is poor, communications are disrupted, or steep slopes make access unsafe. It does not replace field verification. Instead, it helps teams plan where to go first, what evidence to collect, and which locations may require urgent attention.
What users can investigate
- Where exposed buildings form concentrated clusters along the mapped flood corridor.
- How the flood extent relates to river bends, confluences, terraces, and steep valley walls.
- Which roads, bridges, settlements, and access routes may require priority inspection.
- Where buildings outside the mapped extent may provide safer reference locations or support areas.
- How alternative camera positions improve briefings for responders, planners, and communities.
- Where additional satellite interpretation or field verification is most needed.
From analysis to communication
Flood assessment often combines many layers: satellite imagery, elevation, flood extent, buildings, roads, administrative boundaries, and population information. Each layer is useful, but presenting them separately can overwhelm people who do not work with GIS every day. The 3D scene brings them into one coherent view.
The color scheme supports rapid interpretation. Red highlights buildings that intersect the mapped flood extent, while green provides a clear comparison with buildings outside it. The terrain explains the pattern. Together, these elements turn a technical spatial overlay into a visual story that can be understood during a short emergency briefing.
Supporting preparedness as well as response
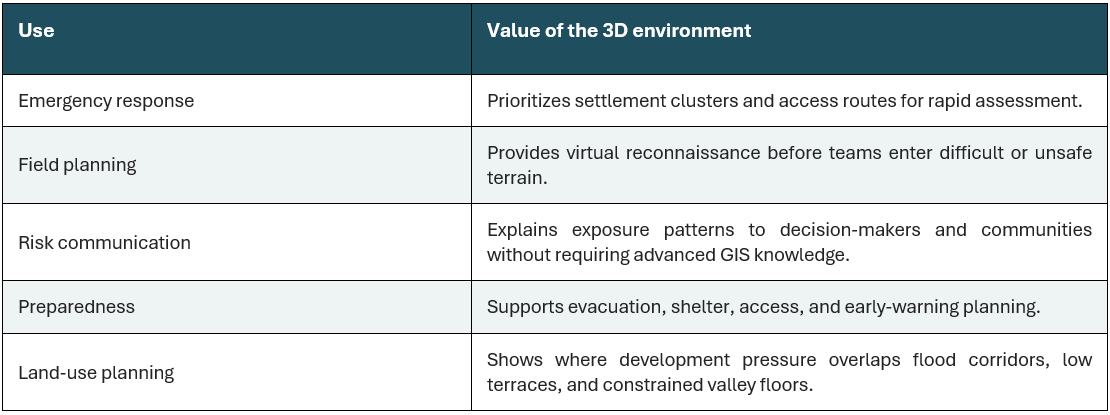
The same 3D environment can support future risk reduction. Historical flood extents, modeled scenarios, evacuation routes, shelters, helipads, schools, health facilities, bridges, and early-warning infrastructure can be added to the scene. Planners can then examine where new development should be restricted, which communities may become isolated, and where safer access or relocation options should be considered.
Data and analytical context
The maps and geospatial analyses were prepared using Esri software. Input data included imagery from PeruSAT-1, Planet, BlackSky Global, Esri, and ArcGIS, as well as OpenStreetMap data (2026, 2024). Satellite imagery was accessed through the International Charter: Space and Major Disasters following a request by the Asian Disaster Reduction Center on behalf of Nepal’s Department of Hydrology and Meteorology.
Satellite interpretation indicated widened channels, fresh sediment and boulder deposits, bank erosion, and impacts on settlements along the corridor. The 3D building analysis adds an exposure perspective by identifying structures that intersect the mapped flood area. Because remote sensing cannot confirm the condition of every building, results should be combined with field observations, local reports, photographs, and engineering assessments wherever possible.
A clearer path from maps to action
From Kathmandu and Thame to the flood-affected valleys of Rasuwa, the lesson is consistent: geospatial information becomes more useful when people can see the landscape relationships behind the analysis. ArcGIS Pro 3D makes those relationships visible. It enables exploration of flood extent, buildings, imagery, and terrain within a single virtual representation of the affected environment.
For the Esri user community, the Rasuwa Flood 2026 visualization demonstrates how a familiar desktop GIS workflow can support emergency mapping, virtual reconnaissance, exposure analysis, and public communication. When flood risk is easier to see, it is easier to explain, verify, prioritize, and act on. The three recent flood incidents show that the impact areas are the same and that the same type of settlement was damaged.
Also Read – FEMA Release Guidelines for Coastal Flood Hazard Analysis and Mapping