

The indices calculated from satellite imageries such as the Normalized Difference Vegetation Index (NDVI), Normalized Difference Built Index (NDBI) and Normalized Difference Water Index (NDWI) have indices values ranging from -1 to 1.
This could be a very basic question for remote sensing and GIS professionals but still, many beginners would like to understand why the above indices range from -1 to 1. The second question that comes to mind is what these indices’ value signifies.
Let’s first go through the Normalized Difference Vegetation Index (NDVI):
What is the
Normalized Difference Vegetation Index (NDVI)?
NDVI is a vegetation index to monitor the condition of vegetation or vegetation health. NDVI is the most commonly used vegetation index for monitoring vegetation globally. Many other vegetation indices such as the Enhanced Vegetation Index (EVI), Ratio Vegetation Index (RVI), and Perpendicular Vegetation Index (PVI) take into account the soil emissivity (one of the major limitations of NDVI).
Here, I am discussing only NDVI. You may read about other vegetation indices from the following link: http://goo.gl/xmbUWQ
How is NDVI Calculated?
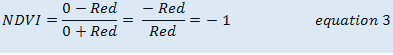
Mathematically NDVI is calculated using the below formula:
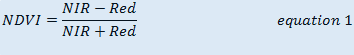
We know that the chlorophyll content of vegetation absorbs strongly the red wavelength of sunlight and reflects in near-infrared wavelengths.
Please have a look at the below figure. The figure shows the spectral response of healthy vegetation. In the red band (620 – 750 nm) there is maximum absorption of sunlight and in near-infrared (750 to 1400 nm) maximum of sunlight is reflected back.
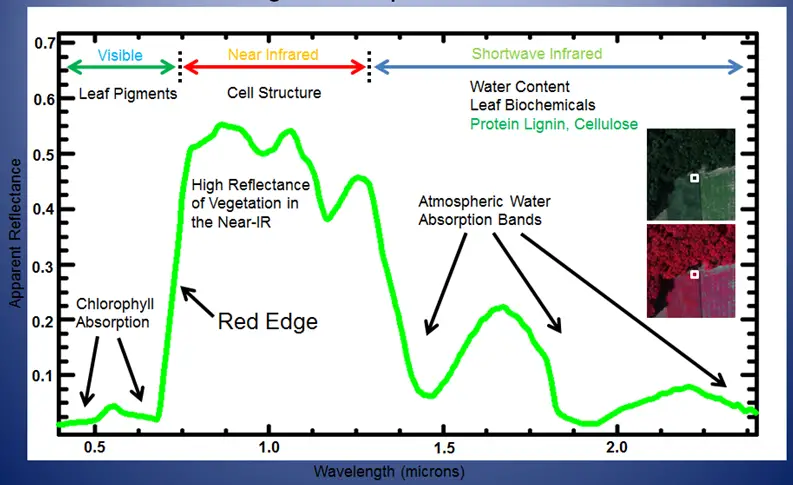
Vegetation Spectral Curve
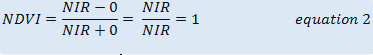
So, when energy is absorbed in a red band its reflectance will be zero (ideally or in the case of ice or water).
Now, in the case of healthy vegetation.
But in the case of dry crops or unhealthy vegetation, the chlorophyll content is either very low or maybe no chlorophyll in case of dry crop.
In below, the spectral curve of unhealthy vegetation shows that there is very little absorption of sunlight or more reflectance in the red band (620 – 750 nm) rather in the case of healthy vegetation. In the near-infrared band ((750 to 1400 nm)) the reflectance is also very low as the maximum of energy is being absorbed in the NIR band.
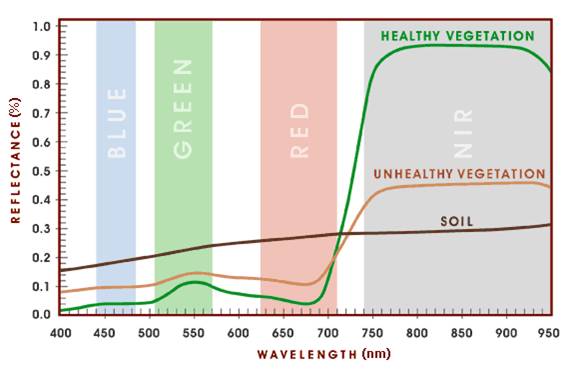
Spectral Curve of Healthy and Unhealthy Vegetation
So,
Now we can conclude, why the NDVI value ranges from -1 to 1.
What is the significance of NDVI value from -1 to 1 in the interpretation of NDVI images?
Upon the classification of NDVI images in various ranges based on the NDVI value, significant information can be extracted from imagery.
- Barren rocks, sand, or snow show very low NDVI values (-0.1 to 0.1)
- Shrubs and grasslands or senescing crops – 0.2 to 0.5
- Dense vegetation or tropical rainforest – 0.6 to 0.9
- Deepwater- -1
What is the Normalized Difference Built-up Index (NDBI)?
The Normalized Difference Built-up Index (NDBI) is a remote sensing index used to identify urban and built-up areas from satellite imagery. It leverages the difference between the reflectance values in the Near-Infrared (NIR) and Shortwave Infrared (SWIR) spectral bands, where built-up areas tend to have higher reflectance in the SWIR band and lower in the NIR band. This index helps in urban planning, monitoring urban sprawl, and analyzing the impact of urbanization on the environment. The NDBI indices range from -1 to 1.
How is NDBI Calculated?
The formula for NDBI is-
NDBI = (SWIR – NIR)/(SWIR + NIR)
Let’s have a look at the spectral curve of Built-Up and find out the solution to why NDBI ranges from -1 to 1.
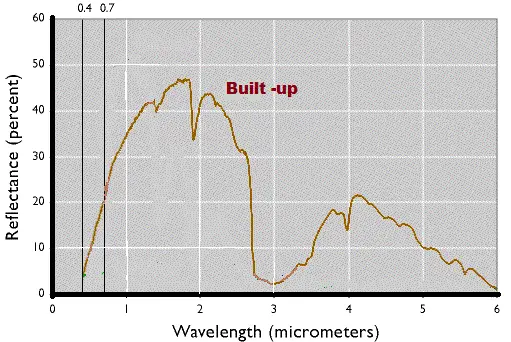
Spectral Curve of Built-up
Use the above logic as of NDVI, to get the answer independently.
What is the Normalized Water Index (NWI)?
The Normalized Water Index (NWI) is a remote sensing tool used to identify and monitor water bodies in satellite imagery. It typically uses the difference in reflectance between the green and Near-Infrared (NIR) spectral bands, where water bodies reflect more in the green band and absorb more in the NIR band. One common form of the index is the Normalized Difference Water Index (NDWI). Normalized Water Index (NDWI) is an index to extract water bodies from satellite imagery. This index is useful for water resource management, tracking changes in water bodies, and studying the effects of drought and climate change on water availability.
How is NDWI Calculated?
Following is the formula to derive NDWI-
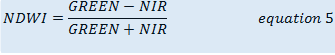
The logic is the same here for the reason of being NDWI indices value from -1 to 1.
Spectral Curve of Clear Water and Turbid Water
The NDWI maximizes the reflectance of water by using green band wavelengths and minimizes the low reflectance of NIR by absorbing a maximum wavelength. As a result, water features are enhanced owing to having positive values and vegetation and soil are suppressed due to having zero or negative values
Read related article:


Hi
Your article was very helpful with clarify the concept of NDVI. I am still a little bit confused though. When I create my NDVI or NDBI images using ArcGIS Pro indices, the value of pictures is way beyond -1 to 1! for example, my NDVI image value starts from -92 to 36. I guess i have missed a step here and I have no idea how to get that. Would it be something you can teach me here?
Thanks
select a specific area of interest (AOI) so it could avoid all other errors and redo the same. regards..
NDVI value range -1 o +1
Should use the tool of “Extract by value” anf filter the range from -1 to -1. Your faced issues is pixel error
Selamat siang Pak
Mau nanya kalau yg metode normalized differnce soil indek itu rentangannya -1 sampai 1 apakah benar pak
Pak aku ngolah kelembaban tanah pake metode NDSI ini tapi hasilnya itu minus semua pak?
Itu kira2 gimana ya pak?
Makasi Pak sebelumnya
Dear, how and from which option you got the (Reflectance and wavelength ) graph?