About Author
Sofia Minashkina
Email: sofiamin@gmail.com
Various branches of production and human activity harm the environment, being sources of atmospheric pollution and an increase in temperature on our planet. Today, environmental protection is necessary and requires significant efforts from humanity. Climate change, which causes the weather to become unsustainable, affects life on Earth as we know it. Rising temperatures are causing glaciers to melt, and extreme weather events damage farm productivity, jeopardizing global food security. There are many more reasons to be concerned, and effective measures to protect the environment should be taken, which can be helped by active and passive remote sensing.
Maps that present spatial data are increasingly crucial for environmental planning and management. The development and improvement of data analysis methods made it possible to obtain more than descriptive maps but perspective maps with a visual display of spatial relationships. Platforms that make it possible to display graphical information obtained from spatial data include a set of powerful tools called GIS systems.
Sources in space or the air provide valuable mapping data. The science of obtaining information about our planet from its surface using satellites or high-flying aircraft is called remote sensing. Sensors attached to devices that capture the radiation reflected from the Earth are responsible for collecting data. The machines perform active or passive remote sensing depending on the type of sensors. Passive sensors detect natural energy emanating from the Earth’s surface. Active ones, on the contrary, use internal stimuli to collect data, including a laser to project it onto the Earth. The sensor measures the time it takes for the beam to be reflected.
GIS makes it possible to use natural resources more efficiently and reduce the negative impact of human activity on the environment. Different types of remote sensing provide data collection, while geospatial systems provide visualization.
This solution is vital for managing natural resources and solving environmental problems. Furthermore, data and maps help assess and manage the impact of earthquakes, droughts, floods, and other natural disasters. GIS information is also being applied to address climate change, habitat loss, pollution, and population growth. It is a reliable way of monitoring and getting information about the location and current resources.
Monitoring Mining Environmental Influence
All stages of mining activity, from exploration to mine closure, have a direct and indirect impact on the environment. The maintenance and operation of a mine can lead to changes in land use, as well as negative impacts such as deforestation, pollution of water sources, and more. The liquidation, decommissioning, and conversion of mines can also result in similar significant environmental impacts, such as soil and water pollution. The infrastructure needed to operate a mine can also affect wildlife habitats and migration routes.
Remote sensing provides benefits for studying the impact of mining operations on the environment in the form of multispectral imagery, repeated coverage, and synoptic coverage. This technology has also been successfully applied to study the effects of underground mining, sedimentation, and the processes occurring after the disposal of production waste.
Monitoring changes in former mines is critical since landscape changes after this type of activity can cause the release of harmful substances into the atmosphere and lead to extreme events. Hyperspectral remote sensing provides vital information about land use, mine effluent location, vegetation cover, and water source conditions.
Monitoring Illegal Mining in Brazil and its Influence on the Brazilian Amazon Rainforests
The Amazon region covers 9 Latin American countries and is the largest rainforest in the world and the most extensive river system. Another important fact about this region is that it accounts for 10% of global biodiversity. Due to its ecological characteristics, the Amazon Basin is the most critical part of the world’s environmental system and plays a crucial role in climate regulation. It also plays an essential role in the economic well-being of the region.
Illegal mining in Brazil has several hotspots in 9 states. Many of these points are in the Amazon. Yanomani and Munduruku are indigenous reserves also known as areas of illegal mining. In 2018, 30 tons of gold were illegally mined in Munduruku. Moreover, known centers of illicit gold mining are interior cities, including Itaituba and Jacareacanga.
Satellite Imagery Analysis by EOSDA Analytics
EOS Data Analytics helps 22 industries make better decisions by providing them access to products and solutions based on satellite data using AI algorithms. The company provides reliable satellite imagery analytics to commercial, scientific, and government organizations, enabling them to implement sustainable practices in various industries. EOSDA’s mission is to use satellite technology to make accurate and sustainable data-based decisions in various sectors, including agriculture, forestry, and mining.
The negative impact on the environment is one of the most critical problems for the mining industry today. EOSDA solutions enable monitoring remote and hard-to-reach areas and analyzing the data. Thanks to the company’s products, you can access vegetation, soil, water bodies, and subsidence information. It contributes to the improvement of planning and prevention of emergencies.
For instance, the company provides data to study the contamination of the Tapajós River due to illegal mining. Tapajós River is one of the largest tributaries of the Amazon, which passes through 65 municipalities in Brazil and plays a vital role in the development of the country. The area of the river basin exceeds the size of the territory of France. Two-thirds of the region is covered by tropical forests, home to various species of animals, including rare species. There are also more than 300 species of fish in the river.
There are other crucial species here, namely 1.4 million people, including ten indigenous tribes, who also depend on the river for jobs, food, water, and other resources. The Tapajós River basin is also essential for agricultural production in the region. Environmental problems associated with the pollution of the river by waste from mining endanger the region’s economic well-being and the existence of all living things in it.
Case 1
EOSDA Crop Monitoring is an all-in-one precision farming solution developed by EOS Data Analytics. This online satellite platform provides reliable field monitoring and helps farmers make timely crop protection and resource use decisions.
The solution gives access to data on the state of the soil, vegetation, and field activities. Reliable historical weather data from 1979 and a 14-day forecast make it possible to improve the planning of field activities and track and study factors that affect crop yields year after year. The values of NDVI and other indices are a source of critical data on vegetation throughout the growing season. Human eyes can quickly identify a healthy green plant or detect a problem when leaves or other parts turn yellow. Developing plants contain large amounts of cellular structures and chlorophyll, absorbing red light and reflecting near-infrared light. In unhealthy plants, the reverse processes occur.
Satellite sensors are a source of data for NDVI analysis, as they measure the wavelengths of light that green plants absorb and reflect. In this case, the main difference between passive and active remote sensing is that with active remote sensing the imagery for analysis can be obtained at night, which increases the possibility to get a cloudless picture. On the EOSDA Crop Monitoring platform an array of indices is available. Vegetation density estimation is not only crucial for farmers, however. This feature of the EOSDA solution can also be applied to other industries, such as mining. The image below shows the same active mine in 2017 and 2022 (Itaituba, State of Pará, Brazil). Even though the size of the mine has not increased during this time, the effects of this activity on the region are permissive.
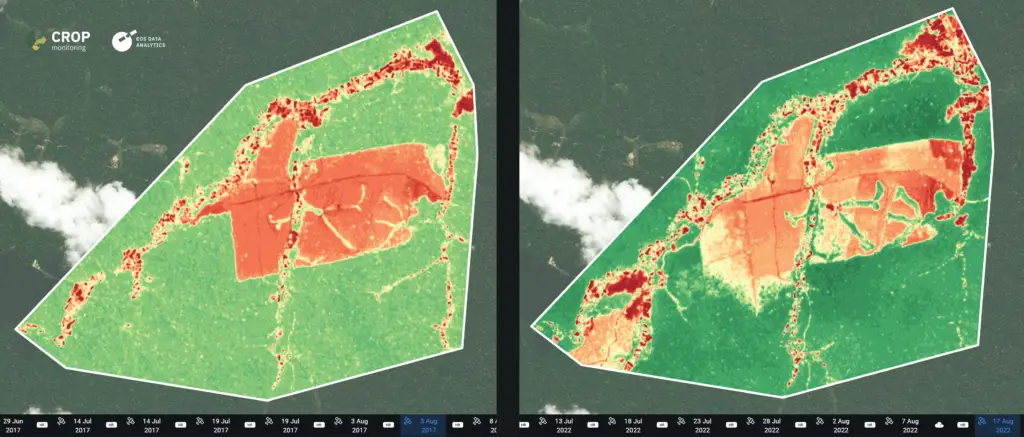
After (right side). Satellite image date: August 17, 2022
Coordinates: 7.2737° S, 56.3011° W
Resolution: 10m
The area of the zone is marked with a white line: 1560 ha.
Satellite: Sentinel-2
Red marks areas without vegetation, which increased after washing the soil. As a result, it can be seen that even without the construction of new mines, the region has 50 hectares less vegetation. It is evidenced by the data analysis using the EOSDA Crop Monitoring platform.
The multispectral device SENTINEL-2 became the source of images for analysis. This broadband multispectral mission provides geographic information on any scale (from local to international) and measures 13 spectral bands. This mission is characterized by a high frequency of return visits and provides reliable monitoring of soil, vegetation, and water cover. The data can be used to track agricultural and crop health, environmental issues, forests, water sources, and space planning.
Case 2
Converting satellite data to NDVI values enables creating images that provide information about the type, condition, and the number of plants that cannot be seen with the naked eye. To calculate the indicators, NDVI calculators take images from an optical satellite. As a result, they create a georeferenced raster result.
Having a value for each pixel in an image makes it possible to assign different colors to different ranges of NDVI values. Thus, obtaining a map of NDVI changes in false colors is possible. It is possible thanks to various GIS systems. There is no standard color map, and the most widely used maps are those with realistic colors, on which high NDVI values are highlighted in green.
A comparison of imagery from 2017 and 2022 shows deforestation (on the latest one) in one of these “mines” and then the formation of clearings and the opening of roads in places of illegal mining. The water used in the extraction washes the soil, and the residues end up in the waters of Tapajós River. The NDVI scores obtained using the EOSDA Crop Monitoring platform demonstrate the effects of harvesting and the negative impact of side effects. The area of open land increased by 66 hectares.
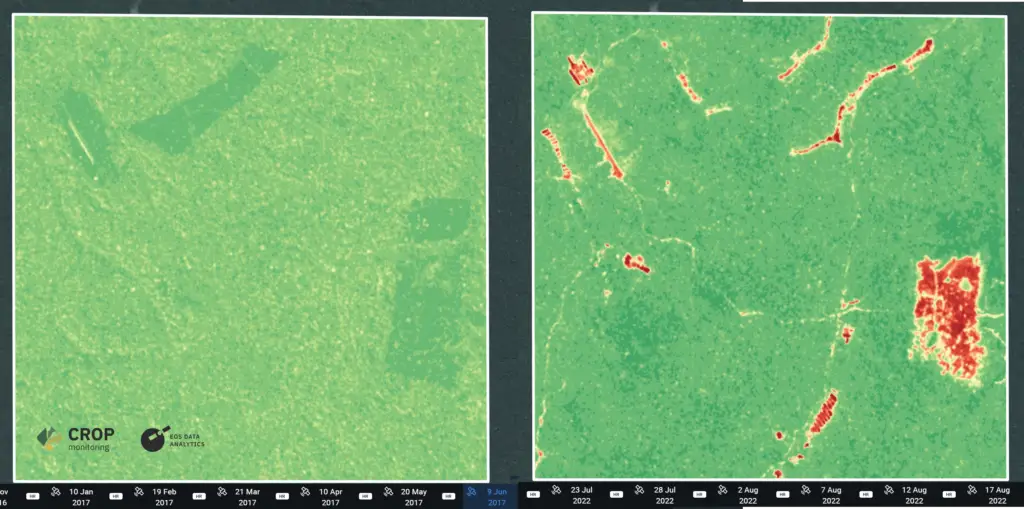
After (right side). Satellite image date: August 22, 2022
Source: EOS Data Analytics.
Satellite: Sentinel-2
Resolution: 10m
Region: Itaituba – State of Para, Brazil
Total area in the screenshot: 1900 ha.
Coordinates: 7.4784° S, 56.6089° W
Case 3
The ingress of sewage into the Tapajós River leads to pollution and ecological imbalance. Outwardly, the consequences of pollution are expressed in the fact that parts of the river differ in color. Calculating the normalized difference chlorophyll index (NDCI) on the EOSDA Crop Monitoring platform enables detection of vegetation on the surface of water bodies. In a shallow area of the Tapajós River, a “bloom” formation was found. Near the rocks, algae grow, harming aquatic inhabitants and the ecosystem.
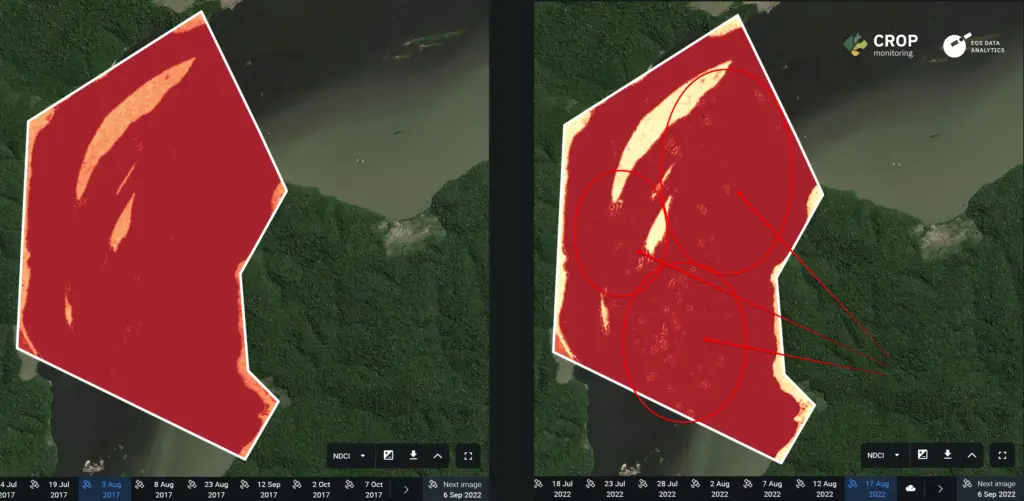
After (left). Satellite image date: August 17, 2022
Source: EOS Data Analytics
Coordinates: 5.5942° S 57.2139° W
Region: Ponta do Bacabalzinho, Itaituba – State of Pará, Brazil
Resolution: 10m
The area of the zone marked with a white line: 1120 ha
Satellite: Sentinel-2
Case 4
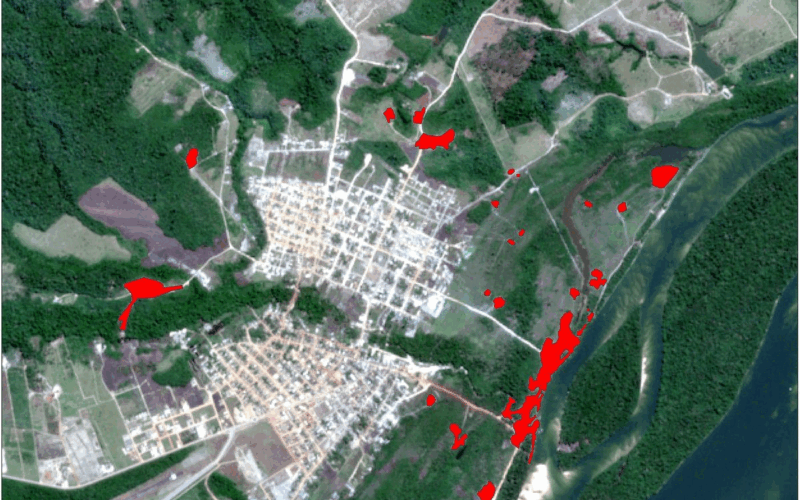
The red spots in the image (below) indicate that there will be an increase in tree felling in 2022. This process leads to an expansion of the area of open land plots and infrastructural buildings that are used for mining.
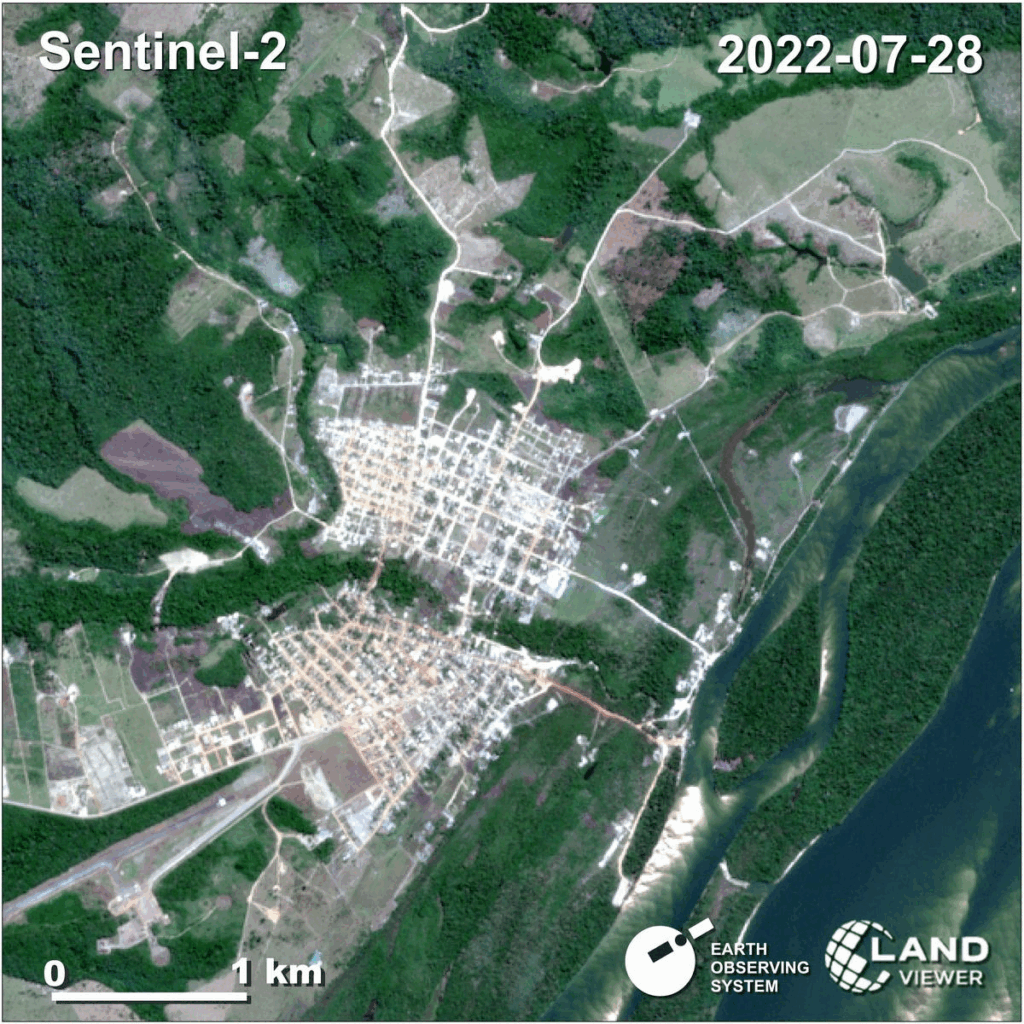
Source: EOSDA LandViewer by EOS Data Analytics. 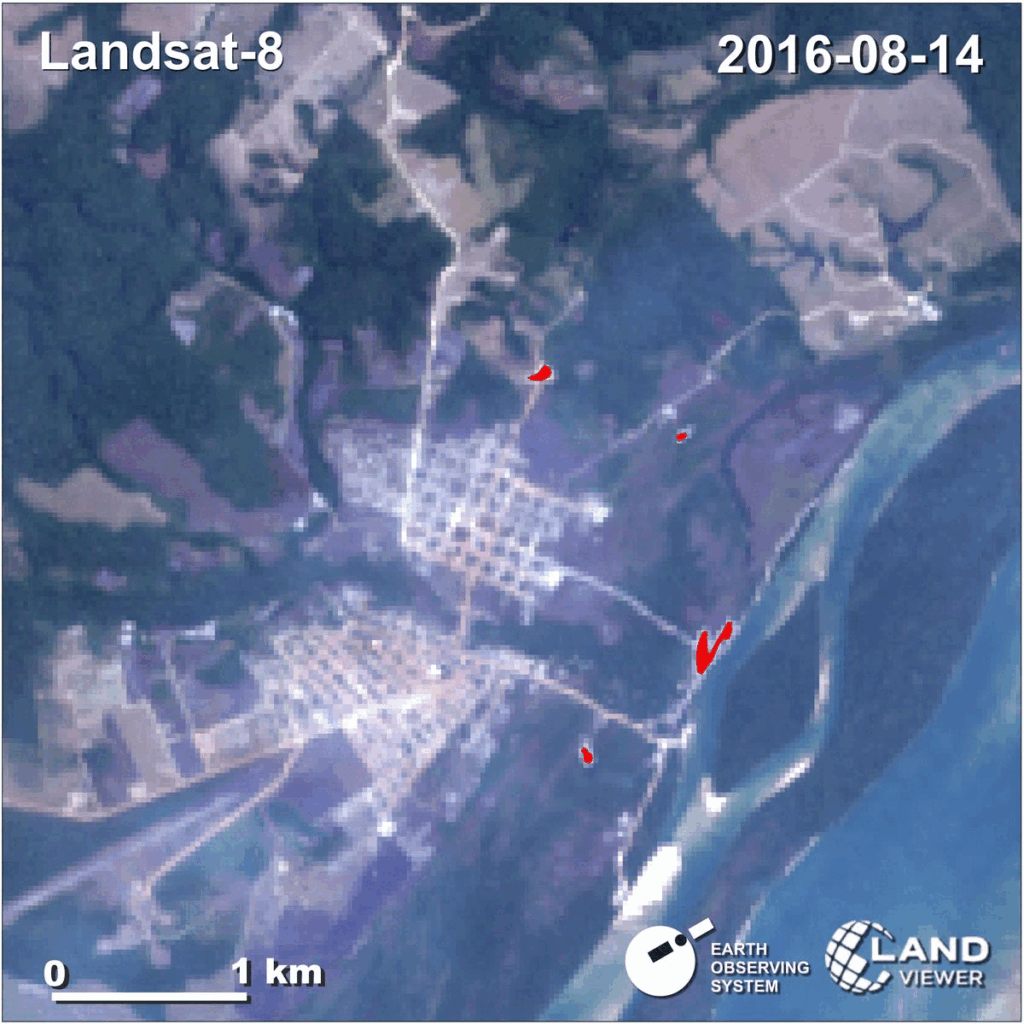
Source: EOSDA LandViewer by EOS Data Analytics. 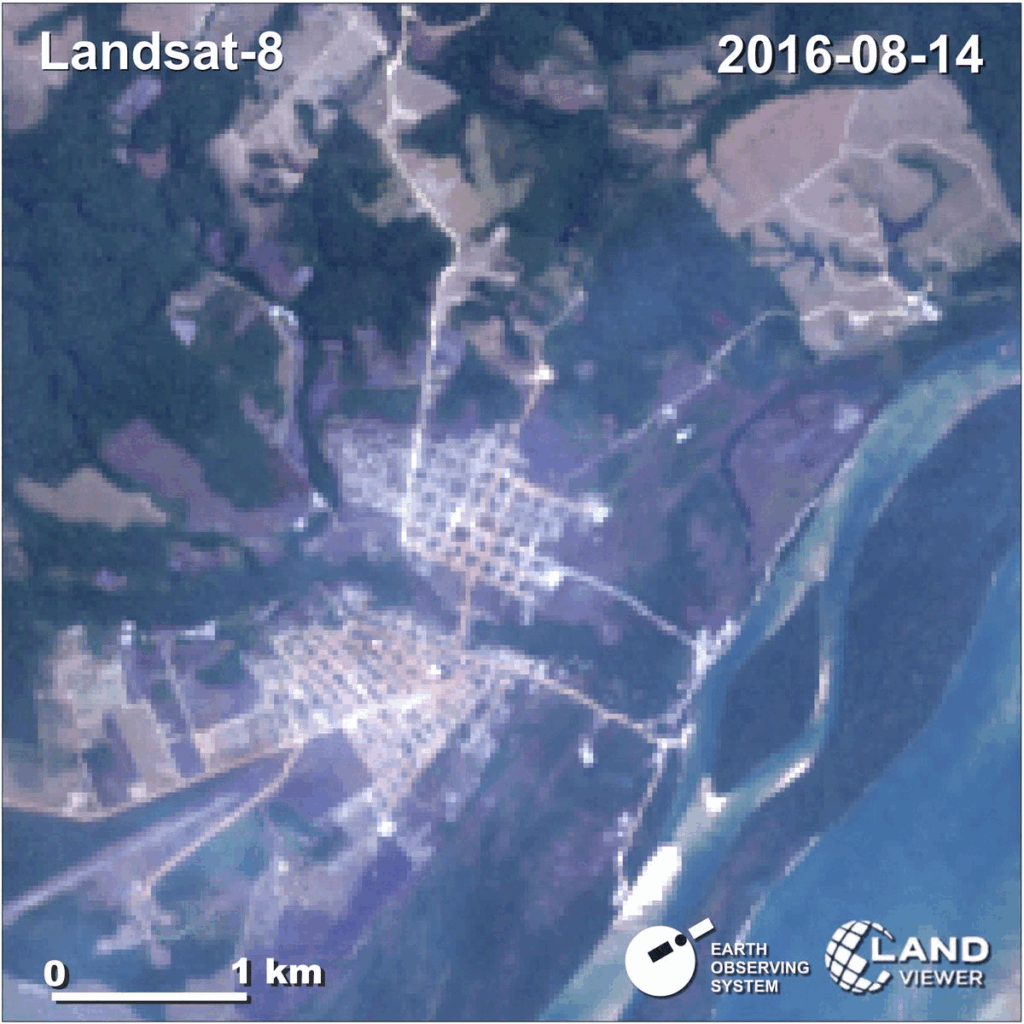
Source: EOSDA LandViewer by EOS Data Analytics. 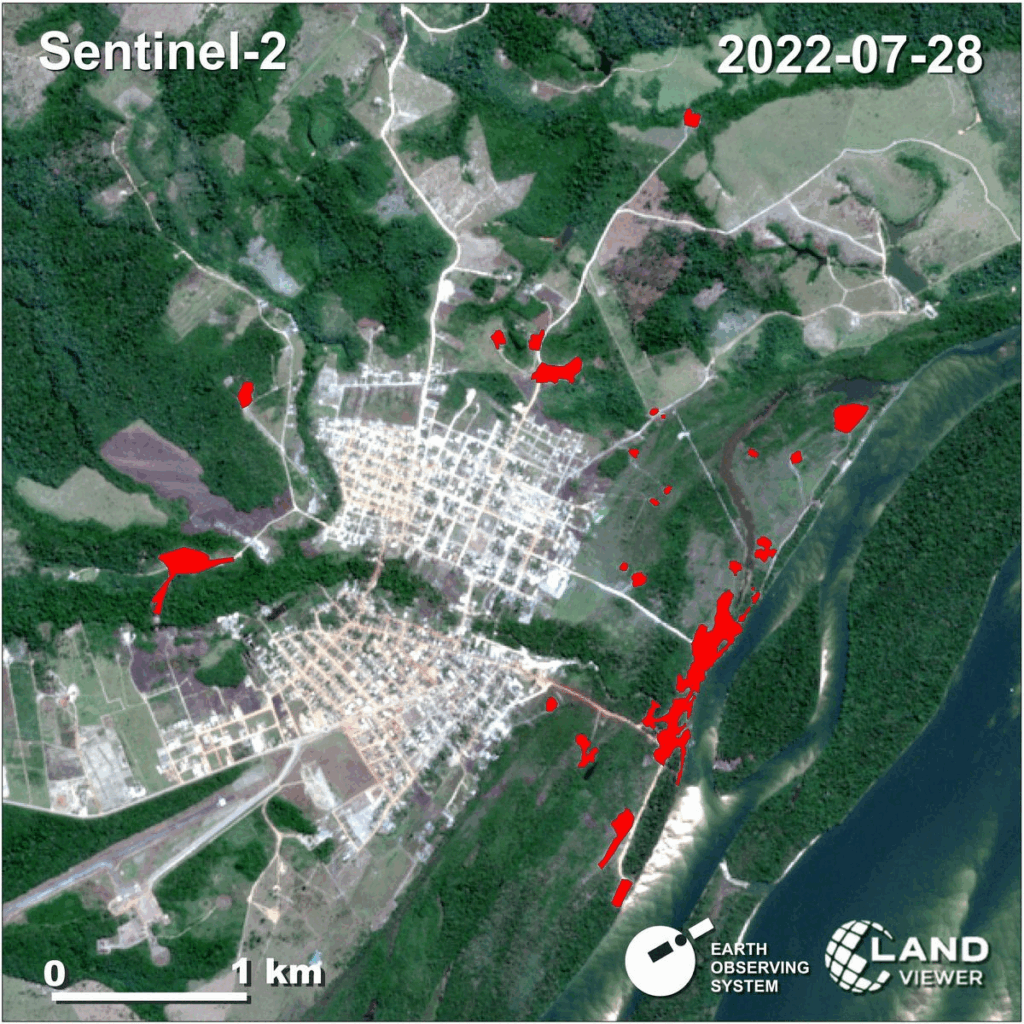
Source: EOSDA LandViewer by EOS Data Analytics.
The images are taken from the Landsat 8 satellite, equipped with an operational ground imager (OLI) and a thermal infrared sensor (TIRS). These two sensors perform different functions.
OLI is designed for the imagery collection and application of 9 spectral bands with different wavelengths of visible, near-infrared, and short-wavelength light. It is necessary to monitor 185 kilometers of land (115 miles). A 15-30 meters resolution makes it possible to distinguish between different land-use objects.
TIRS enables Landsat-8 to support new applications and continue thermal imaging. With this sensor, it is possible to measure the rate of evapotranspiration, which helps to manage water resources effectively.
Some sectors of human activity negatively affect the environment, and mining is one of them. This industry leaves behind hazardous waste that has to be isolated from wildlife after the mines are closed. However, this is impossible if the mining was carried out illegally and no one took care of the integrity of the waste storage facilities. Subsequently, toxic substances enter the soil and pollute water sources, without which humanity is unlikely to be able to survive. Modern technology, fortunately, makes it possible to track both the condition of the former shah and detect illegal mining activities. GIS, microwave remote sensing active and passive, and satellite imagery enable the timely detection of various environmental threats.
Also Read –
How GIS and Geospatial Tech Can Enhance the Agriculture Sector
