About Author
Team Lead, Geospatial Technology, iMerit
He’s a geospatial professional blending AI with GIS to predict the future—literally. He holds a B.Sc. in Geography, an M.Sc. in Remote Sensing & GIS, and is currently pursuing a Ph.D. in Geoinformatics. He leads complex GIS projects at iMerit, mentors teams, develops proof-of-concepts, and drives client satisfaction through efficient data delivery and workflow optimisation. iMerit is a software-delivered AI data solutions company providing high-quality data to power AI.
Geospatial technology is no longer niche. It is now infrastructure. In 2025, GIS is less about drawing boundaries and more about making decisions. From satellite to street-level, every pixel now holds a signal. The value lies in extracting it at scale—and doing that fast, accurately, and responsibly.
At the centre of this shift is a new kind of GIS stack. It blends high-resolution imagery, cloud infrastructure, machine learning, and human validation. It is part automation, and part human-expert review. This stack is being deployed in sectors that are core to the next decade: agriculture, climate resilience, and infrastructure. At iMerit, we work behind the scenes alongside data scientists, GIS analysts, and AI teams. We help transform geospatial data into usable intelligence. Here’s what we are seeing from customers across the new GIS stack.
1. Global Construction Mapping Needs Rules
Monitoring global construction provides a policy, climate, and supply chain signal. Tracking large-scale construction—highways, solar parks, logistics hubs—requires more than machine vision.
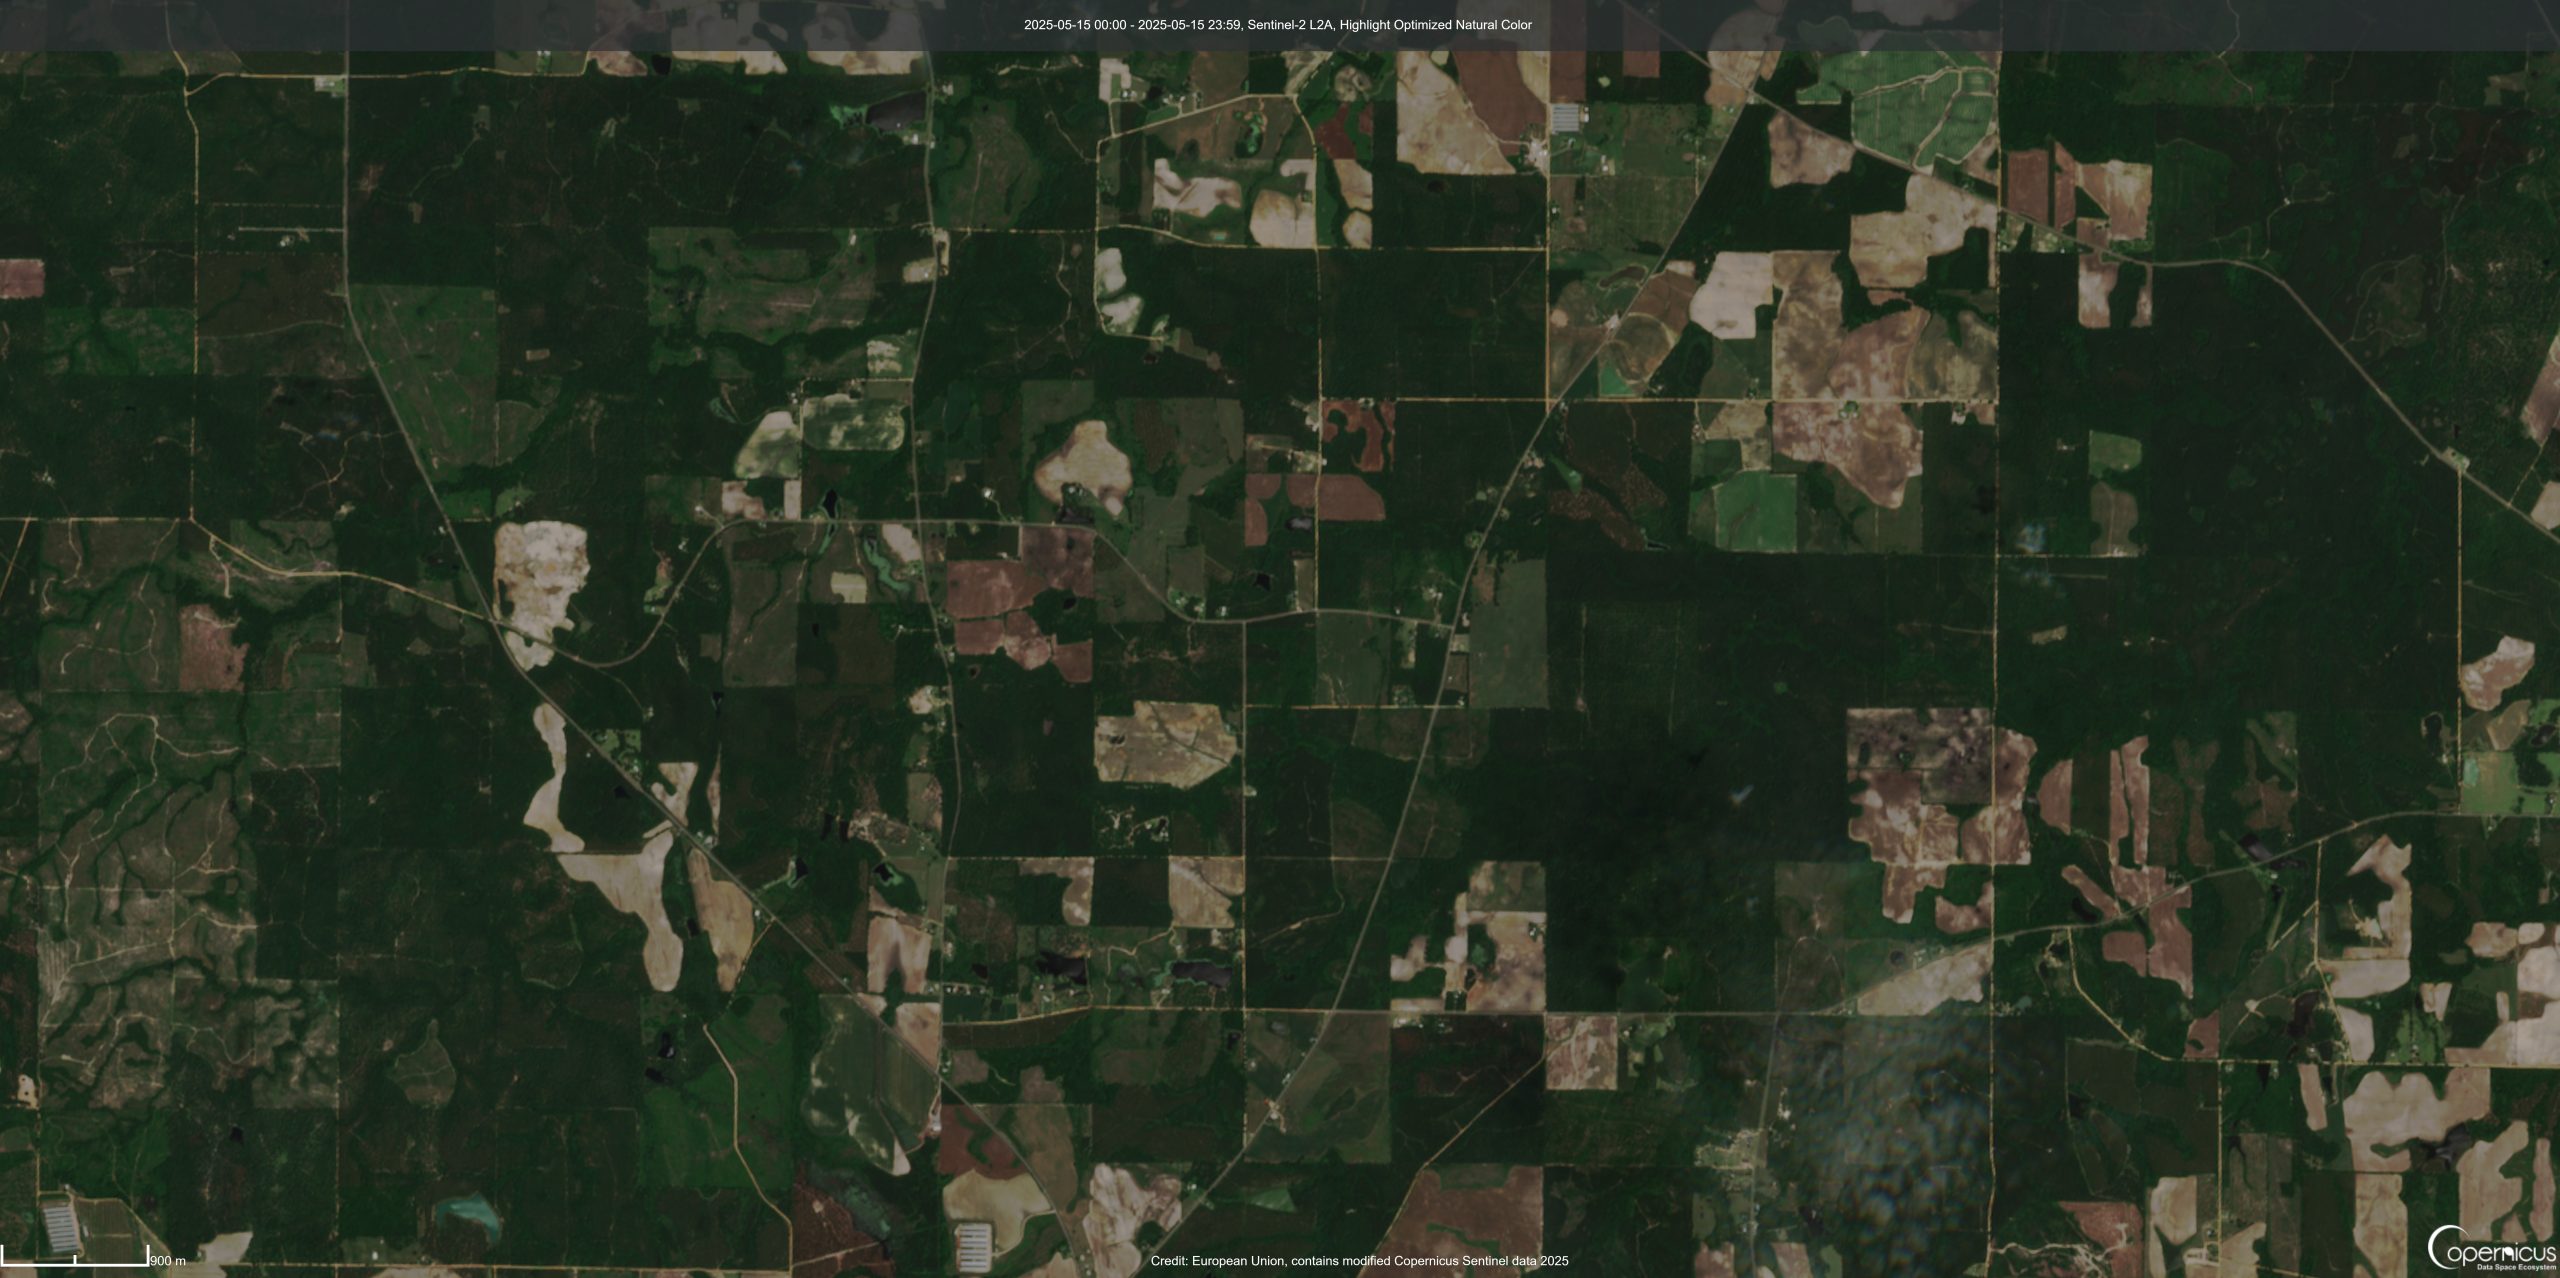
We work with multi-temporal Sentinel imagery and archived datasets to surface high-relevance sites. Python scripts flag patterns, but the critical value is in thresholding and validation. Building boundaries needs context. That is where human validation loops in—setting thresholds, filtering out false positives, and aligning timelines. Clean outputs flow into climate models, zoning maps, or real estate platforms. Our teams at iMerit label and refine these inputs, ensuring models catch real developments, not noise. The result? Sharper trend analysis for infrastructure planning and ESG insights.
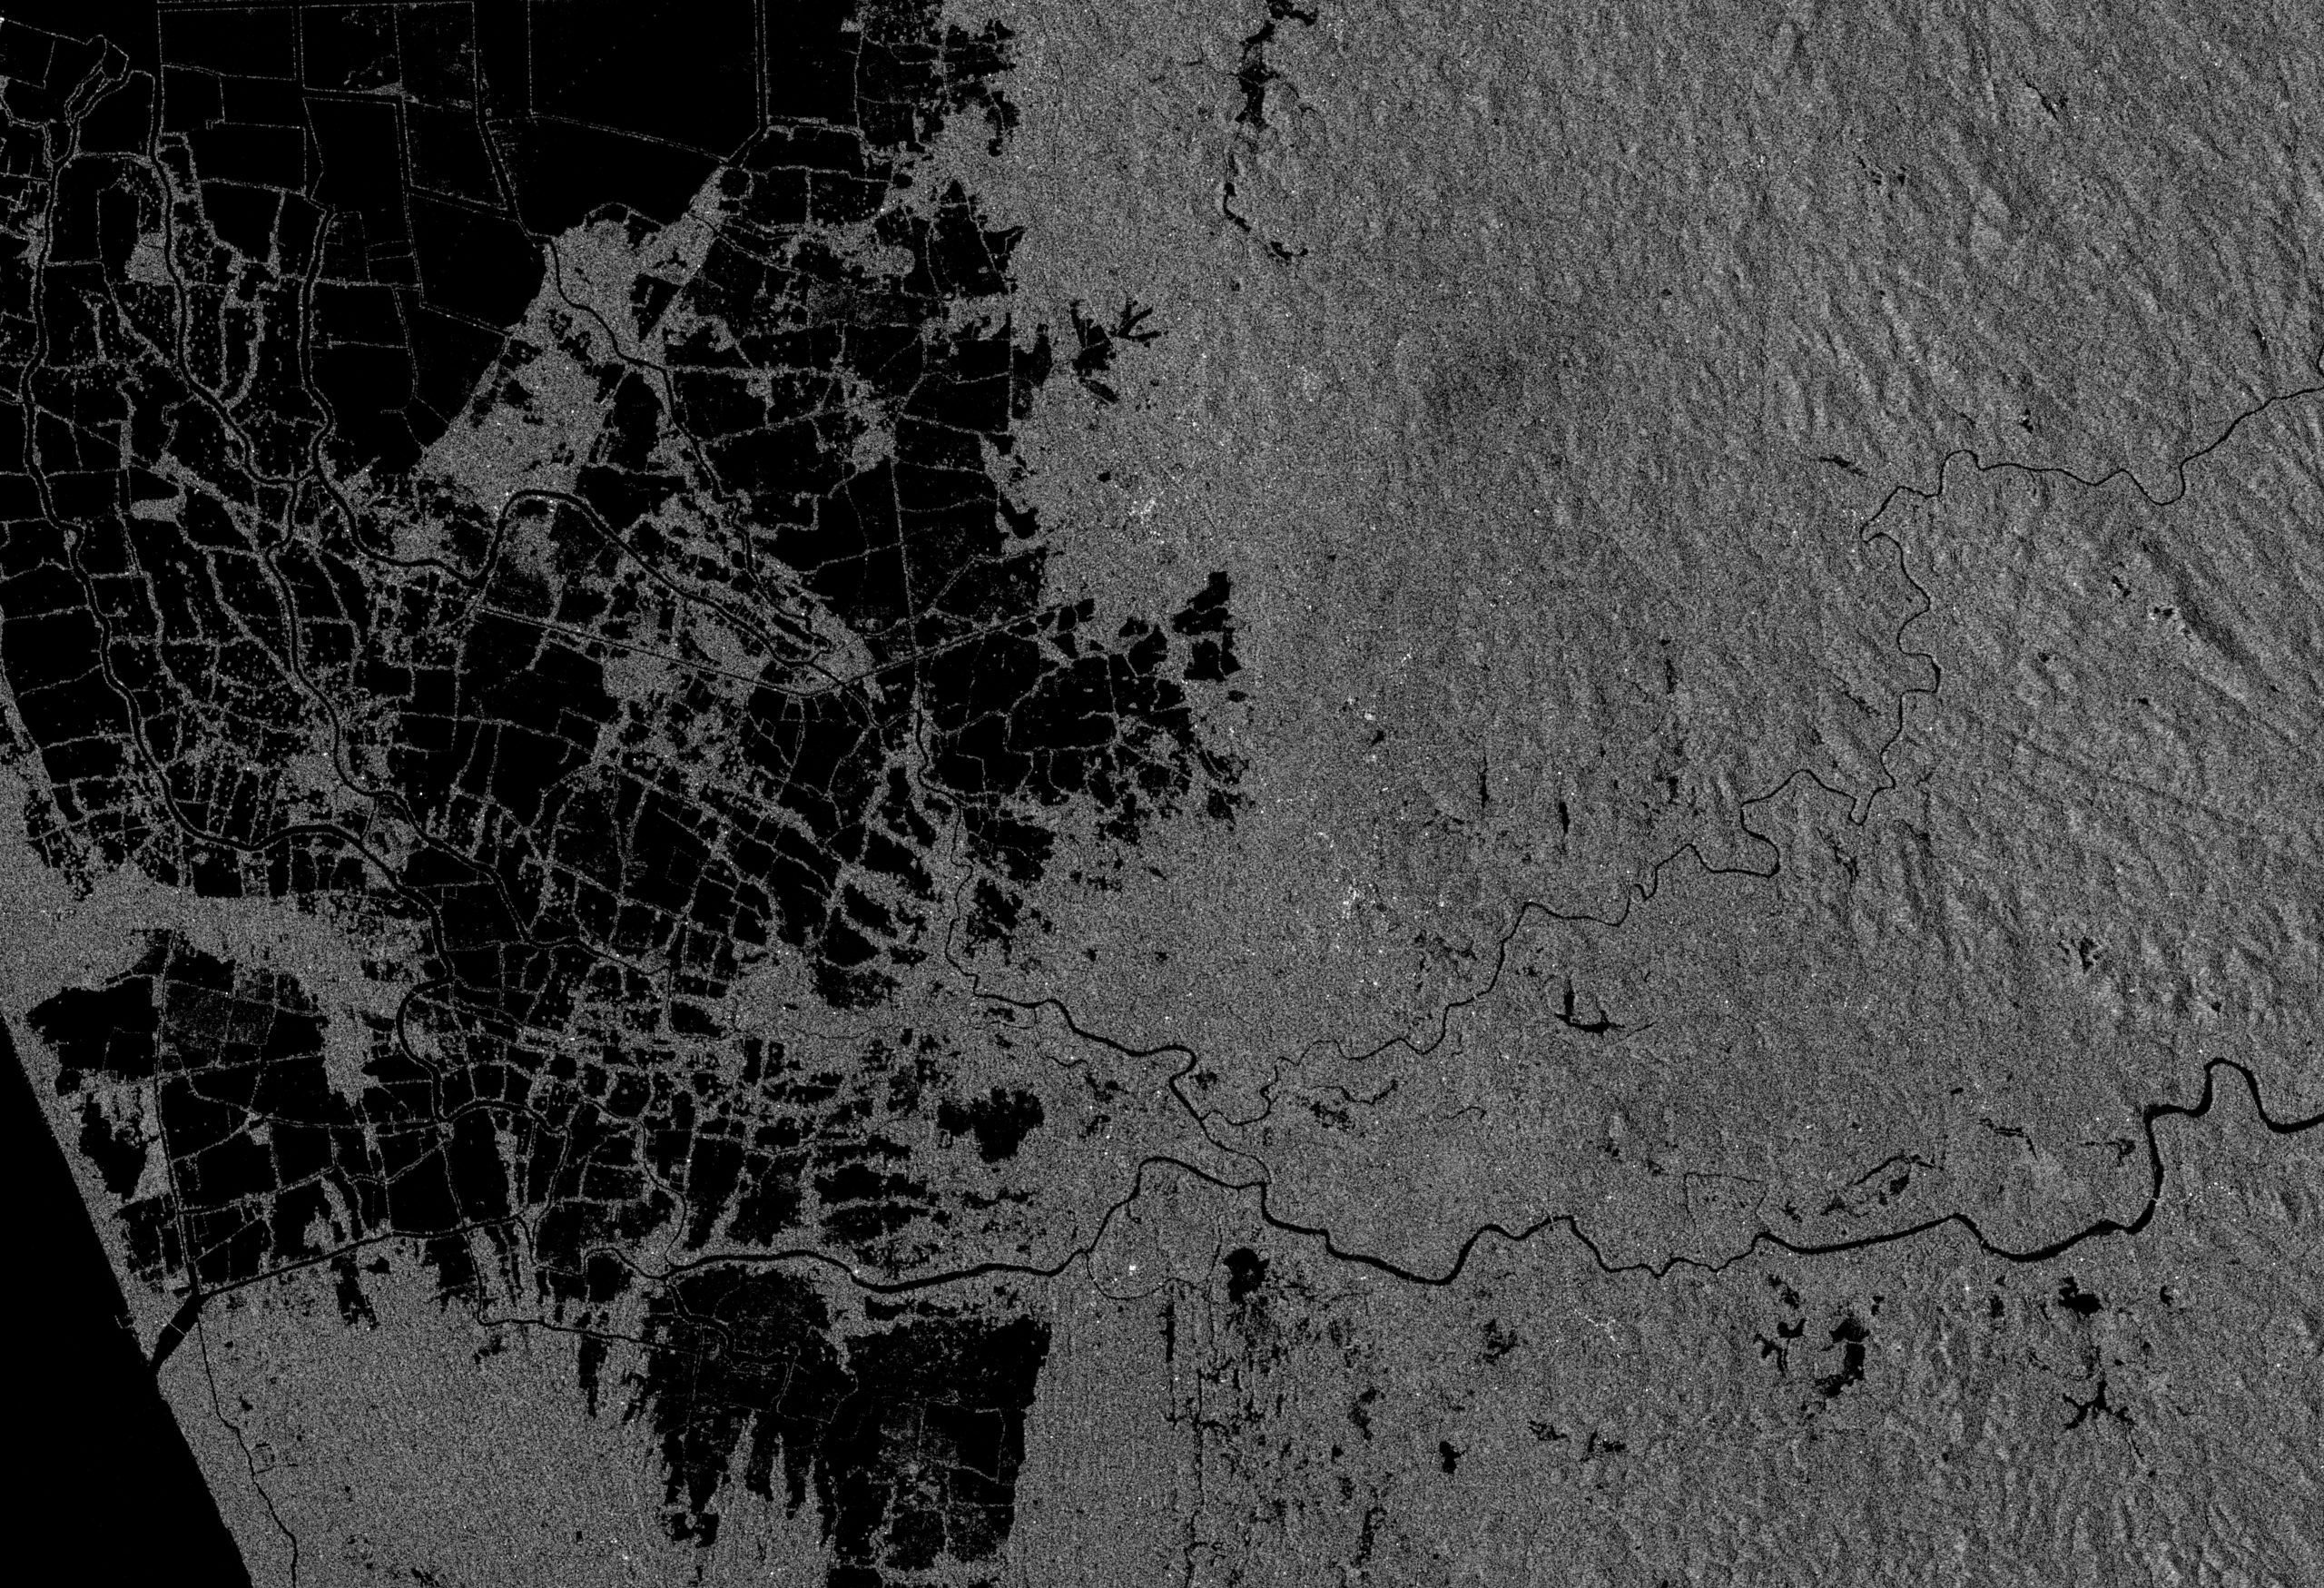
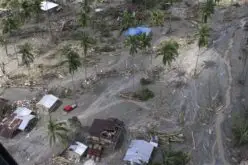
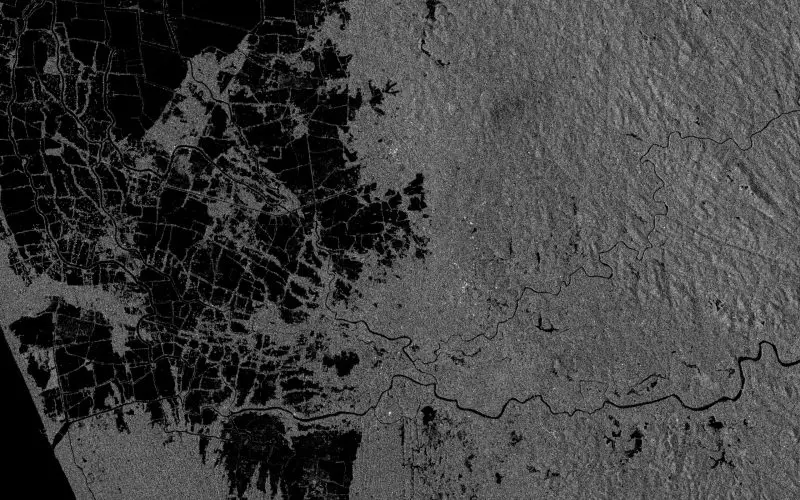
2. Flood Mapping Needs SAR—and a lot of human Quality Assurance
Optical imagery breaks down during floods due to issues in cloud cover and in reading submerged terrain. SAR (Synthetic Aperture Radar ) is useful in these situations. It picks up water presence through backscatter values. However, those signals vary with terrain and sensor type. A misread pixel can mark dry land as submerged. To mitigate these errors, iMerit experts use QGIS for classification, then verify layer by layer. Our role: manage the middle between a very slow, fully manual process and a very risky, fully automated process.
Also Read – How GIS and Geospatial Tech Can Enhance the Agriculture Sector
We cross-reference topography, apply terrain-specific calibrations, and validate outputs in QGIS. The speed matters. But so does accuracy. Especially when lives and logistics depend on it.
3. Land Use Classification Isn’t Static Anymore
Land Use / Land Cover (LULC) Classifications support everything from zoning to emissions reporting. But auto-classifiers often struggle, especially in fragmented or transitional landscapes.
Agencies and platforms model land use change over time. This means annotating massive datasets with granular classes—urban, peri-urban, agri, forest, water. Most models fail without quality training data. iMerit works with teams to annotate complex geographies, build edge-case libraries, and adapt label taxonomies over time. The point is not to make perfect maps. Rather, it is to teach models how to evolve.
4. Road and Rooftop Extraction Is Getting Granular
A clear vector layer of roads and rooftops is not just for maps. It powers everything from telecom rollout to EV routing. Our team has developed automated methods to identify rooftop types and map road networks by analysing DSM (Digital Surface Models) and satellite imagery.
What we have found works best: ML pre-tagging plus human review. Why it matters: urban planning, telco rollout, autonomous routing, insurance modelling.
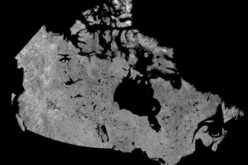
5. Integrating Historical Geospatial Data
Historical aerial images are invaluable but often geospatially inconsistent. We improved their accuracy by extracting Ground Control Points (GCPs) using archived flight path data and Google Maps and aligning them with modern datasets.
- Google Earth Pro was used for visual cross-verification.
- Python scripting in Google Colab automated the transformation and alignment process.
Geo-referencing by hand, if needed. It is not glamorous work, but it makes older data usable again. It becomes critical for tracking infrastructure evolution, coastline change, or forest loss across decades.
6. Precision Agriculture: From Boundaries to Biomass
In agriculture, yield and land use decisions start with accurate mapping. Teams are building workflows that:
- Map farm boundaries from high- and low-res imagery
- Use drones to identify individual crop rows
- Count plants and estimate biomass for yield modelling
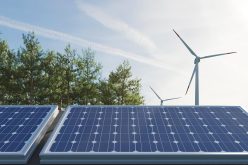
The data then flows into farm management systems. It helps optimize inputs like water, fertilizer, and labor. This isn’t innovation for innovation’s sake—feeding a growing population without scaling emissions is necessary.
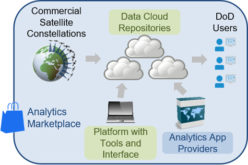
The Stack That Enables It – What ties all this together?
- QGIS: The engine for spatial analysis, vector extraction, and classification
- Google Earth Pro: The go-to for visual verification and historical overlays
- Python + Google Colab: For automation, model training, and shared workflows
- Human-in-the-loop: For interpreting edge cases and improving models
Together, this stack allows for both speed and accuracy. It supports agile workflows without compromising context. And it scales across teams, sectors, and geographies.
Why Humans-In-The-Loop Still Wins
AI is fast, but it can be wrong. Analysis of complex imagery is still not a solved problem in either traditional Vision AI or Generative AI. SAR misclassifies flooded fields. LULC models confuse bare land and concrete. Drones pick up noise in shadows. Human-in-the-loop workflows solve for that. Annotators validate boundaries, fix label drift, and catch exceptions. They also provide the training data that powers next-gen models. Without them, automation becomes an assumption.
Looking Ahead: GIS as Infrastructure
GIS is no longer just a technical function. It is becoming foundational. Industries that run on physical infrastructure now run on spatial data. Agriculture. Telecom. Insurance. Government. In all of these, the ability to map, model, and act on geospatial intelligence will define competitiveness. The good news: the tools are here. Scalable cloud environments. Trained spatial analysts. All of it can work together—if we build smart pipelines.
Inference: Mapping the Earth is no longer enough. Understanding it is the baseline. Acting on it—fast, accurately, and ethically—that’s the edge.