What is Spatial Interpolation?
Spatial Interpolation is a process of creating a surface based on values at isolated sample points. Sample points are locations where we collect data on some phenomenon and record the spatial coordinates. We use mathematical estimation to “guess at” what the values are “in-between” those points. We can create either a raster or vector interpolated surface. Interpolation is used because field data are expensive to collect, and can’t be collected everywhere.
In other words, spatial interpolation predicts values for cells in a raster from a limited number of sample data points. It can be used to predict unknown values for any geographic point data elevation, rainfall, temperature, chemical dispersion, noise level or other spatially-based phenomena. Interpolation is commonly a raster operation, but it can also be done in a vector environment using a TIN surface model. There are several well-known interpolation techniques, including spline and kriging.
style="text-align: justify;">Why to Interpolate?
The assumption that makes Spatial interpolation a viable option is that spatially distributed objects are spatially correlated; in other words, things that are close together tend to have similar characteristics. For instance, if it is raining on one side of the street, you can predict with a high level of confidence that it is raining on the other side of the street. You would be less certain if it was raining across town and less confident still about the state of the weather in the next county.
Using the above analogy, it is easy to see that the values of points close to sampled points are more likely to be similar than those that are farther apart. This is the basis of interpolation. A typical use for point interpolation is to create an elevation surface from a set of sample measurements.
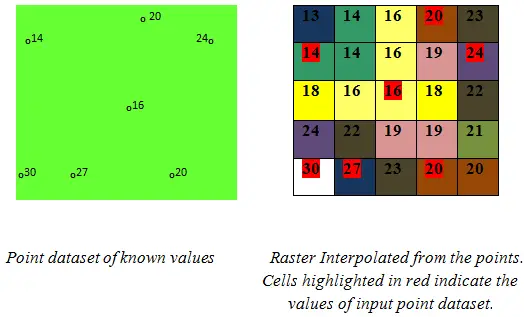
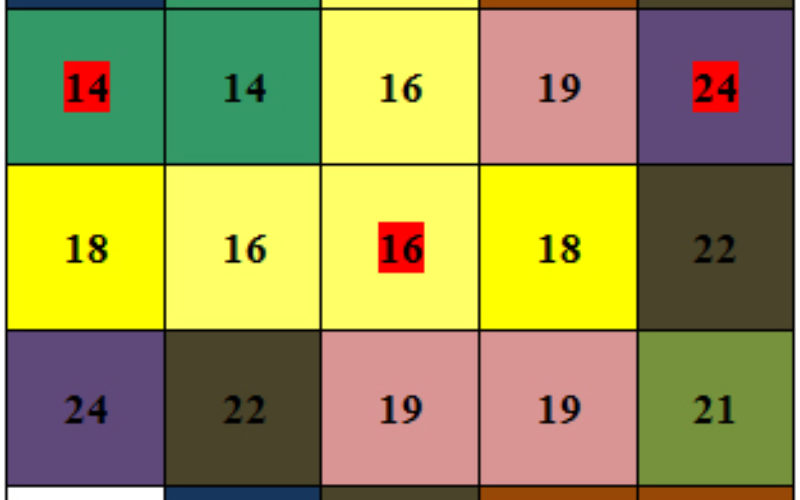
The left-hand graphic above is a point dataset of known values. The right-hand graphic is a raster interpolated from these points. Unknown
values are predicted with a mathematical formula that uses the values of nearby known points.
Spatial Interpolation Techniques
Spatial interpolation is the process of using points with known values to estimate values at other unknown points. For example, to make a precipitation (rainfall) map for your country, you will not find enough evenly spread weather stations to cover the entire region.
Spatial interpolation can estimate the temperatures at locations without recorded data by using known temperature readings at nearby weather stations. This type of interpolated surface is often called a statistical surface. Elevation data, precipitation, snow accumulation, water table and population density are other types of data that can be computed using interpolation.
- Interpolation uses vector points with known values to estimate values at unknown locations to create a raster surface covering an entire area.
- The interpolation result is typically a raster layer.
- It is important to find a suitable interpolation method to optimally estimate values for unknown locations.
Because of high costs and limited resources, data collection is usually conducted only in a limited number of selected point locations. In GIS, spatial interpolation of these points can be applied to create a raster surface with estimates made for all raster cells.
To generate a continuous map, for example, a digital elevation map from elevation points measured with a GPS device, a suitable interpolation method has to be used to optimally estimate the values at those locations where no samples or measurements were taken. The results of the interpolation analysis can then be used for analyses that cover the whole area and for modelling.
Much geographical data is collected at sample points (for example, at climate stations). From these known points, it is possible to estimate values in between the points using an interpolation algorithm. This creates a continuous surface from discrete points. Estimating values outside the geographical range of the known points is known as extrapolation.
The purpose of interpolating data in a GIS is often to create continuous surfaces from point or line data. For example, contour lines showing the topography can be interpolated to create a Digital Elevation Model (DEM), which is a continuous surface showing the elevation in a gridded (raster) model.
Spatial Interpolation May Be Used In GIS:
- To provide contours for displaying data graphically.
- To calculate some property of the surface at a given point.
- To change the unit of comparison when using different data structures in different layers frequently used as an aid in the spatial decision-making process both in physical and human geography and in related disciplines such as mineral prospecting and hydrocarbon exploration.
Things to be Aware of While Choosing Spatial Interpolation Technique
It is important to remember that there is no single interpolation method that can be applied to all situations. Some are more exact and useful than others but take longer to calculate. They all have advantages and disadvantages. In practice, the selection of a particular interpolation method should depend upon the sample data, the type of surfaces to be generated and the tolerance of estimation errors. Generally, a three-step procedure is recommended:
- Evaluate the sample data. Do this to get an idea of how data are distributed in the area, as this may provide hints on which interpolation method to use.
- Apply an interpolation method which is most suitable to both the sample data and the study objectives. When you are in doubt, try several methods, if available.
- Compare the results and find the best result and the most suitable method. This may look like a time-consuming process at the beginning. However, as you gain experience and knowledge of different interpolation methods, the time required to generate the most suitable surface will be greatly reduced.
- The characteristics of an interpolated surface can be controlled by limiting the input points used in the calculation of output cell values.
The characteristics of an interpolated surface can be controlled by limiting the input points used in the calculation of output cell values. This can be done by limiting the number of points sampled or the area from which sampled points are taken. Specifying the maximum number of points to be sampled will return the points closest to the output cell location until the maximum number is reached. Alternatively, specifying a fixed radius in map units will select only input points within the radius distance from the center of the output cell unless there are not enough points within that radius.
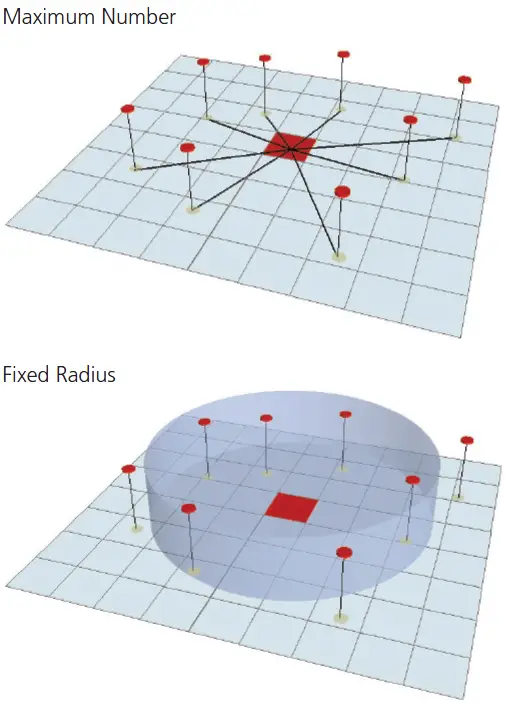
by limiting the input points used. Points can be limited by
specifying a maximum number of points, which will select the
nearest points until that maximum number of points is reached.
Alternatively, a radius can be specified in map units.
Many interpolation tools incorporate barriers that define and control surface behavior in terms of smoothness and continuity. Barriers are needed because sometimes interpolation operations should not be performed across features, such as fault lines, levees, cliffs, and streams, that create a linear discontinuity in the surface. By using barriers, changes in the behavior of the surface can be described and enforced.
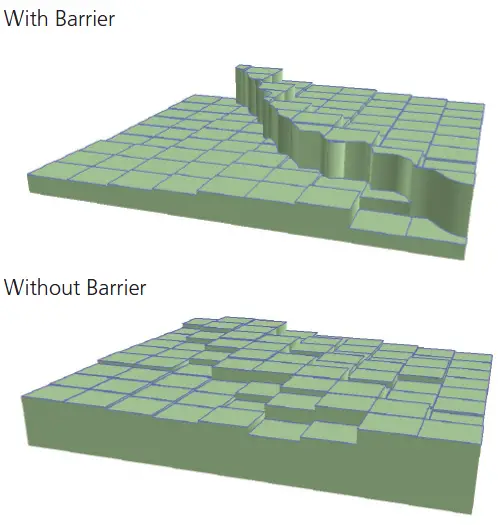
streams, and other features that create linear discontinuity in
surfaces, also control how surfaces are generated. IDW and
Kriging support the use of barriers.
The available interpolation techniques/methods are Inverse Distance Weighted, Spline and Kriging. They make certain assumptions about how to determine the best-estimated values. Based on the phenomena the values represent and on how the sample points are distributed, different interpolators will produce better estimates relative to the actual values. No matter which interpolator is selected, however, the more input points and the greater their distribution, the more reliable the results.
Examples of Spatial Interpolation Applications
Some typical examples of applications for the interpolation tools follow. The accompanying illustrations will show the distribution and values of sample points and the raster generated from them.
Interpolating a rainfall surface
The input here is a point dataset of known rainfall-level values, shown by the illustration on the left. The illustration on the right shows a raster interpolated from these points. The unknown values are predicted with a mathematical formula that uses the values of nearby known points.
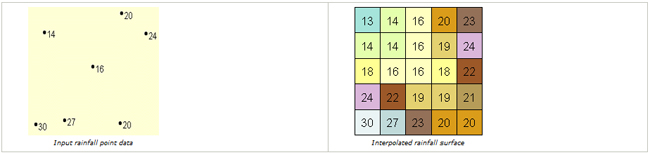
Image; Courtesy @ ESRI
Interpolating an elevation surface
A typical use for point interpolation is to create an elevation surface from a set of sample measurements.
In the following graphic, each symbol in the point layer represents a location where the elevation has been measured. By interpolating, the values for each cell between these input points will be predicted.
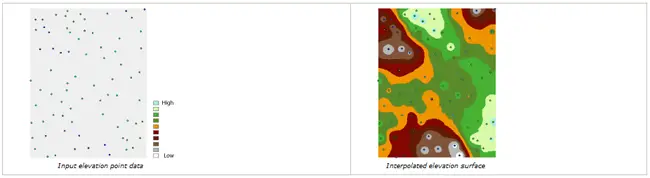
Image; Courtesy @ ESRI
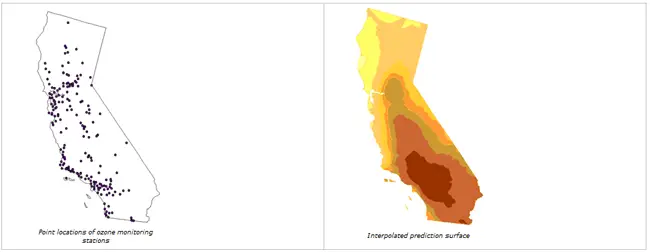
Interpolating a concentration surface
In the example below, the interpolation tools were used to study the correlation of the ozone concentration on lung disease in California. The image on the left shows the locations of the ozone monitoring stations. The image on the right displays the interpolated surface, providing predictions for each location in California. The surface was derived using kriging.
Related Topics
References:
University of the Western Cape
ESRI Education Services
IDRRE – Institute for Digital Research and Education
Kriging Interpolation by Chao-yi Lang, Dept. of Computer Science, Cornell University
Pollution models and inverse distance weighting: Some critical remarks by Louis de Mesnard
Overview of IDW – Penn State University
Reference:
ESRI: Interpolating Surfaces in ArcGIS Spatial Analyst