Observation of Landscape Changes in Coal Mining Areas using Satellite Image
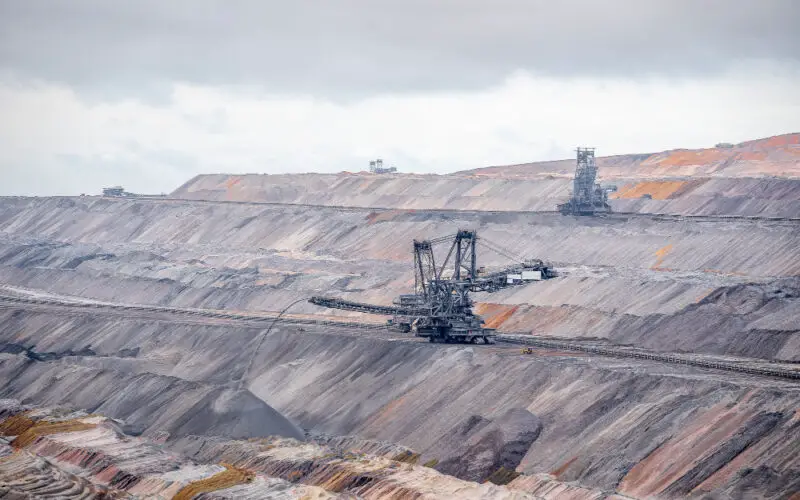
Coal mining can significantly impact the landscape and surrounding environment, including changes in land use, vegetation cover, and water resources. Understanding these changes and monitoring them over time is crucial for effective environmental management and planning. Recent advances in satellite imagery technology have made it possible to observe landscape changes in coal mining areas at a high resolution and over large spatial scales. This has opened up new opportunities for research and monitoring of these areas, and has the potential to inform decision-making around sustainable resource use and conservation efforts.
Objective
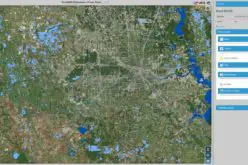
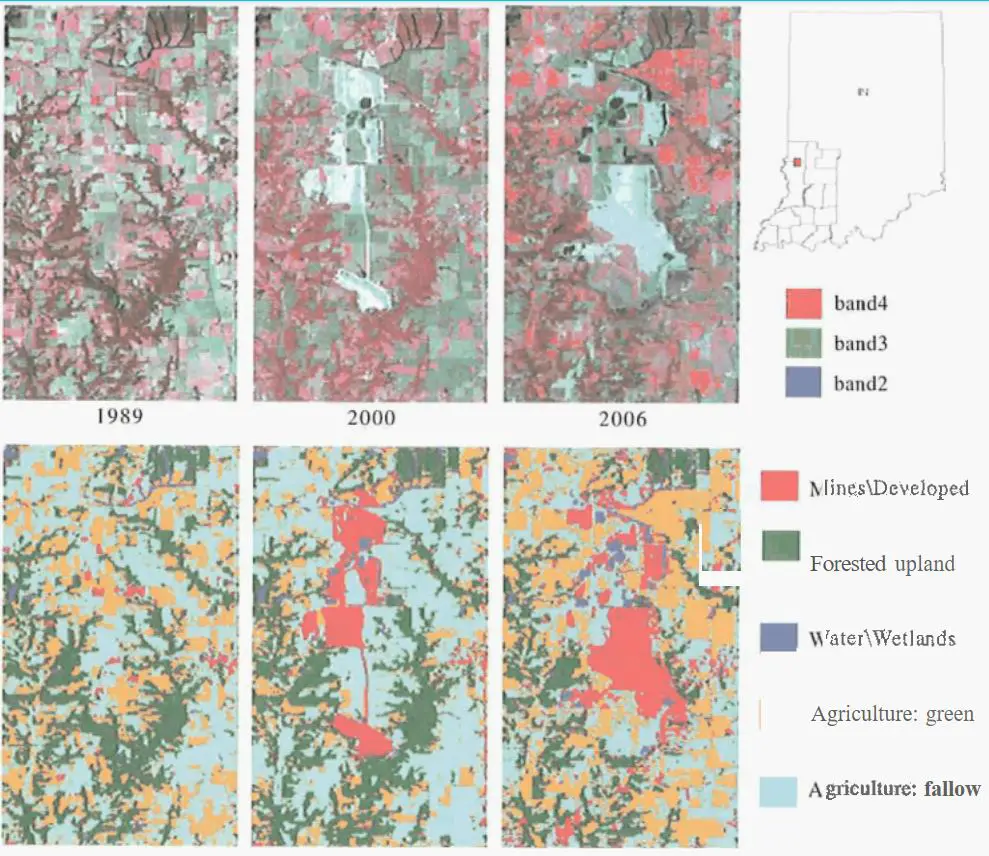
The surface and landscape of the coal mine area release a lot of effluents, acid mine discharge, tailing ponds, impact on groundwater, and effects on mine bench slope. To understand the current stage and proposed coal mine deposits need Remote sensing-based satellite imagery to observe the changes in the surface using Landsat satellite imagery and Airborne satellite imagery for the years 1989, 2000, and 2006. The area of interest is the southwestern part of Indiana state of the USA. Key activities of this exercise are –
- Land use and land cover mapping of the study area using Landsat imagery
- Landscape pattern and changes in the coal mining areas.
Key Activities
The crucial exercises comprise is to collect GPS coordinates from the field to register the image perfectly. The first-order polynomial and neighbour sampling methods were used to maintain perfect RMSE value using ERDAS software
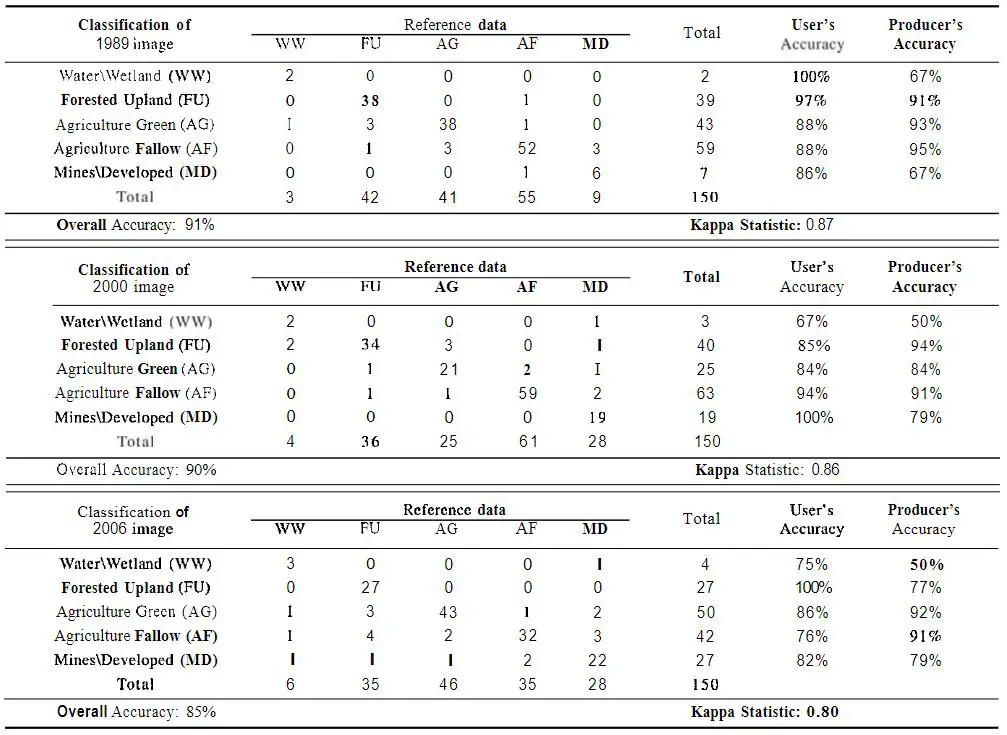
Image classification and accuracy
Supervised and unsupervised classification is used to classify different themes like agricultural lands, vegetal cover, forest cover, and a few minor settlements nearby the coal mining areas. There were 30 spectral classes were used by geolinking them with high-resolution ortho-image to delineate the classes.
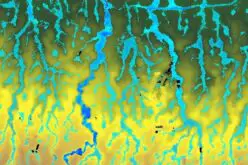
Spatial analysis
The number of Patch (NP), Largest Patch Index (LPI), Total Edge (TE), Clunipiness Index (CLUMPY), and Patch Cohesion Index (COHESION) were calculated for the spatial pattern analysis
Results
The accuracy has reached more than 90 percent in the case of forest and agricultural lands.
Source: https://www.tandfonline.com/doi/epdf/10.1080/10824000809480637?needAccess=true&role=button
Land scale metrics by land use cover
In this study, all CLUMPY values are positive, ranging from 0.36 for WW (WaterWetlands) in 1989 to 0.59 for MD (MinesDeveloped) in 2006. Patch types of the FU (Forest upland), AG (Agriculture: green), and AF (Agriculture: fallow) were more aggregated in 1989 than the WW and MD.
Source: https://www.tandfonline.com/doi/epdf/10.1080/10824000809480637?needAccess=true&role=button
Conclusion
Land use and land cover changes have been discussed and presented in terms of matric using the imageries for the years 1989, 2000, and 2006. The more crucial observation the changes in landscape patterns on surface coal mining using the FRAGSTATS program. This is useful for how coal mining areas are affecting vegetation and decreasing the desired level of the environment in work and buffer areas. On the other hand, this analysis is highly useful to perform a meaningful coal mining area by protecting the surface and groundwater with a sense of protecting the environment.
Source: Tandfonline
Also Read –
Advances & Applications of Geospatial Technologies in Earth Sciences