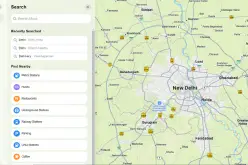
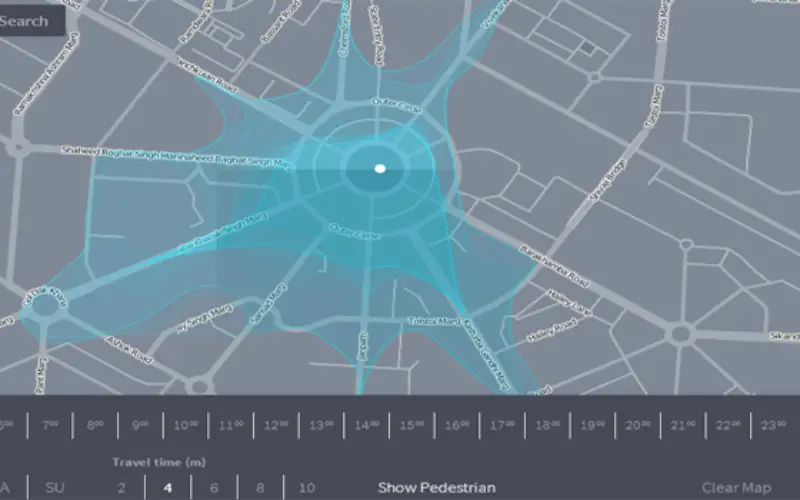
Connaught Place, New Delhi
Travel Time 4 min
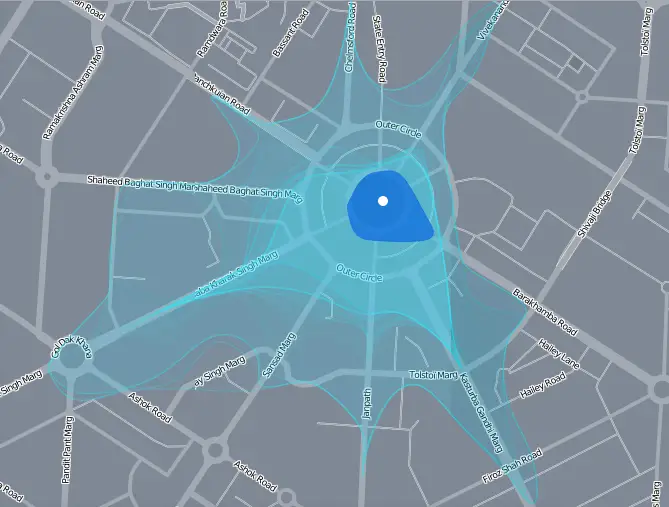
Drak Blue Shape Visualize Pedestrain
We have been using Google Maps to find out the directions, distance and even real time navigation with estimated travel time according to traffic situations.
But a team of developer in supervision of Till Nagel at the University of Applied Sciences Potsdam has come up with an entirely different solution for the travelers to visualize and analysis their travelling experiences in quite a different manner.
Isoscope does not provide the similar services as does by Google Maps. But Isoscope is a very unique and an interactive tool that creates aesthetic visuals about locations that are reachable by car or by a pedestrian in a chosen time from a chosen location. Isoscope is more a way to find or check out the mobility in areas where the traffic conditions changes from hours to hours.
The idea behind the development of Isoscope is coming through our daily situations when our mobility is compromised by traffic jams or during tough driving conditions. Once stuck in traffic, mobility changes with the mode of transportation such as if driving a car could take much more time than a motorbike or bicycle is more flexible to continue its journey. In case a pedestrian then who can stroll whenever he wants to.
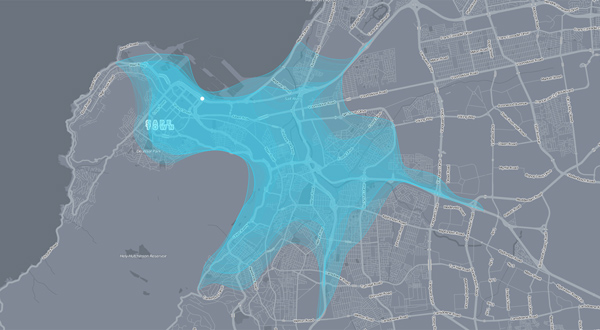
Image Courtesy: Isoscope
Isoscope tries to answer the questions above by comparing different means of transport and their sensitivity for disturbances. The traffic conditions vary hour to hour and places to places. Once stuck in bad traffic condition, will take a longer time to cover a smaller distance.
Keeping this in the background, the developers have developed an online display tool with a map and the organic shape layers of 24 boundaries of reachability, while one layer represents one hour of the day.
With Isoscope one can easily see and compare the influence of traffic conditions on our mobility or compare the reach of different means of transport. Within or among cities. Worldwide.
As we advanced in the ideation of Isoscope and agreed on some kind of organic shapes representing our “mobility scope”, we made our first programming steps in Processing using the HERE API. Initially, we tried to calculate all possible routes from a given location within a specific time. Only afterwards we came across the HERE Isoline API that calculates areas reachable within a given time automatically. Since we wanted Isoscope to be platform-independent, we changed the programming environment from Processing to JavaScript. Several iterations regarding the look of the shapes, map style and UI elements and functionality finally led to Isoscope V 1.0.
The following are the two related projects as Isoscope. The first, Mapnificent by Stefan Wehrmeyaeer, shows areas one can reach by public transport in a given time using idealistic time table data instead of real time data as of Isoscope and is available for major cities of the world.
The second project is Public Transit Travel Time by Andrew Hardin, uses uses a heatmap to show transit travel times in 8 major US cities.
Developer team of Isoscope:
Flavio Gortana, Sebastian Kaim and Martin von Lupin supervised by Till Nagel during the class “Urbane Ebenen: Mobilität” at the University of Applied Sciences Potsdam
Source: Isoscope