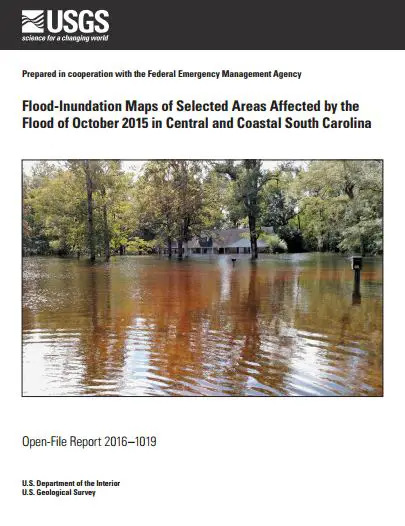
 The U.S. Geological Survey has created 20 new flood inundation maps that can help South Carolinians take steps to prevent or reduce future flood damage in the areas affected by the widespread floods of October 2015. The maps, which document the extent and depth of last autumn’s floodwaters in a dozen central and coastal South Carolina communities, can also help property owners, insurers and disaster relief officials confirm which areas were inundated at the time.
The flood inundation maps, available online, are based on hundreds of high water marks gathered by USGS scientists, said USGS hydrologist Jonathan W. Musser, the lead author of a summary report by the agency’s South Atlantic Water Science Center. Communities covered include Andrews, Charleston, Columbia, Conway, Darlington, Florence, Georgetown, Kingstree, Manning, North Myrtle Beach, Orangeburg and Sumter.
Nearly 100 USGS scientists from as far away as Mississippi and Pennsylvania deployed along South Carolina rivers and streams during and after the Oct. 1-5 floods, which were set off by heavy rains from Hurricane Joaquin. Extensive flooding led to 17 deaths and caused damages estimated at $1 billion or more.
During the flooding the Federal Emergency Management Agency used USGS reports from the field to help decide where to funnel emergency relief supplies, said Chad Wagner, the associate director for investigations for the USGS South Atlantic Water Science Center. Afterwards the federal disaster relief agency commissioned the flood inundation maps. The USGS teams made about 140 stream flow measurements at 86 streamgages, and found and surveyed 652 high water marks, 510 of which were used to produce the new maps.
Seeds and other floating debris deposited on tree trunks and fences make the best high water marks, said Wagner, a Raleigh, NC-based supervisory hydrologist. “You can definitively say those are the result of a specific flood event, because they’re going to be washed away by the next rain. Water stains on bridges are longer lasting, so it’s harder to definitively date them,” he said. In South Carolina, “we had really experienced crews doing the surveys, and the flooded area was extensive, so we collected a lot of high water marks.”
That wealth of information allowed the team to produce 20 maps covering a broad area. The Federal Emergency Management Agency will use them to prepare for future emergencies and mitigate potential flood impacts, Wagner said. Individuals can use the same maps for a myriad of flood safety decisions – for example, siting buildings outside of flood zones, preserving wetlands that act as natural flood absorbers, elevating low-lying structures, or adding flood buffers in vulnerable areas.

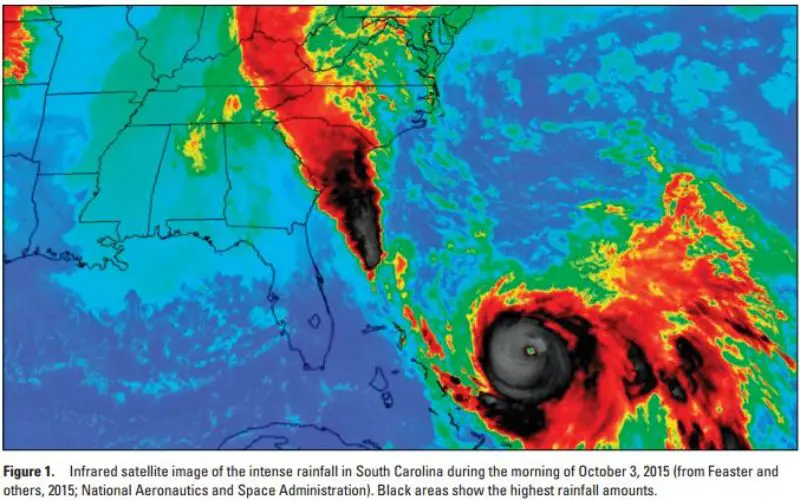
The October 2015 floods followed exceptionally heavy rains, with 21 South Carolina counties recording double-digit rainfall in five days, and one rain gauge in Charleston County tallying 26.88 inches of rain. During the flooding 17 streamgages recorded their highest peak streamflow and/or river height since they were installed. An additional 15 streamgages recorded peaks in the top 5 for their periods of record.
The USGS streamgage on the Congaree River at Columbia peaked at 185,000 cubic feet per second—enough to fill a little more than two Olympic-sized swimming pools per second—onOct. 4, when the river reached a height of 31.8 feet. That was the eighth-highest flood recorded at that spot in the 123 years of the streamgage’s existence, and the highest since April 18, 1936, when the river peaked at 231,000 cubic feet per second and 33.3 feet.
Wagner cautioned that while some reports described the chances of South Carolina receiving rainfall equal to the October 2015 downpours as 1-in-1,000 or even less in any given year, that does not mean the chances are equally slim that the state could experience the same amount of flooding. “One doesn’t equate to the other,” he said. “In fact, the hurricane-spawned rains fell after a period of abnormally dry weather across South Carolina, so the flow in rivers and streams was low and the ground was able to absorb more water than it normally would have. That dampened the flooding somewhat.”
The USGS team used peak flow and peak river height information from its streamgages to calculate the chances that floods of the same magnitude as the 2015 event could occur in any given year. The results varied widely for the communities where inundation maps were created, from a 0.2 percent chance of annual recurrence at a gauge along the Black River at Kingstree to a 10 percent chance at a gauge on the Congaree River in Columbia.