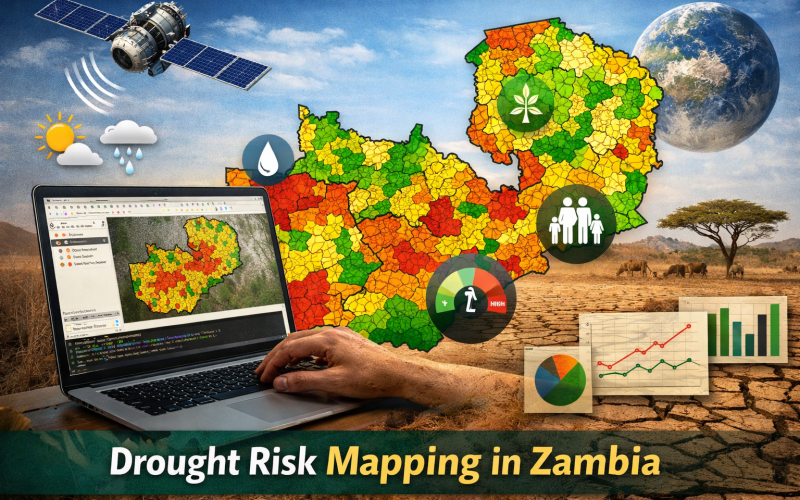
Recurrent droughts continue to pose a significant threat to Zambia’s agricultural productivity, water resources, and socio-economic stability. The increasing variability of rainfall patterns across southern Africa has intensified the need for spatially explicit, data-driven drought assessment frameworks.
A recent technical study conducted by the International Water Management Institute (IWMI) under the CGIAR Climate Action Program presents a reproducible, open-source methodology for national-scale drought assessment using satellite-derived climate indicators and socio-economic datasets . The framework demonstrates how drought risk mapping can be operationalized using freely available data and open-source geospatial tools.
The study highlights how open-source platforms, particularly QGIS, can bridge this gap by integrating long-term satellite data with socio-economic indicators to support drought risk mapping.
Drought Hazard Assessment
Drought hazard was quantified using long-term time series of the Standardized Precipitation Index (SPI), derived from satellite-based rainfall products. Monthly SPI datasets spanning more than two decades were processed in a raster-based environment using QGIS. Drought events were identified by applying threshold conditions (SPI ≤ −1), allowing the classification of drought and non-drought pixels at monthly resolution.
Annual drought frequency was computed by aggregating monthly binary layers through spatial cell statistics. These annual drought layers were subsequently combined to estimate long-term drought occurrence probabilities at pixel level.
Normalization of drought frequency enabled the generation of quantitative hazard maps, which were further classified into qualitative hazard categories ranging from very low to very high. The use of raster algebra and optional Python scripting enhanced automation, reproducibility, and scalability of the hazard workflow.
Also Read – Poverty Mapping Tool for Better Resource Allocation
Drought Vulnerability Assessment
Vulnerability was conceptualized as a composite of exposure, sensitivity, and adaptive capacity. District-level vulnerability indicators were compiled from diverse sources, including agricultural land coverage, groundwater dependence, irrigation extent, public health metrics, food security indicators, and access to early warning systems. Each indicator was standardized to a common scale to ensure comparability across spatial units.
Both equal-weighted and weighted aggregation techniques were demonstrated, allowing flexibility based on expert judgment or data availability. Aggregated vulnerability scores were standardized to derive the Drought Vulnerability Index (DVI), which was spatially joined to administrative boundaries within QGIS. Graduated symbology and classification techniques enabled visualization of relative vulnerability patterns across districts, highlighting areas with structurally limited adaptive capacity.
Integrated Drought Risk Analysis
Drought risk was calculated through pixel-level integration of hazard and vulnerability layers using a multiplicative risk model. This approach captures the interaction between climatic stress and socio-economic susceptibility, generating a continuous risk surface. The resulting maps reveal spatial heterogeneity in drought impacts, with several districts exhibiting elevated risk due to the concurrence of frequent drought occurrence and high vulnerability.
This integrated approach positions drought risk mapping as a dynamic decision-support tool. The outputs can be aggregated to administrative levels for policy application, early warning design, and prioritization of climate adaptation investments. Importantly, the framework aligns with global best practices in climate risk assessment and supports interoperability with national early warning systems and cloud-based geospatial platforms.
Discussion and Implications
The study underscores the technical viability of open-source geospatial tools for operational drought monitoring in data-constrained environments. By combining satellite-based hazard analysis with multidimensional vulnerability metrics, drought risk mapping provides a scientifically rigorous basis for anticipatory action, climate-smart agriculture planning, and water resource management. The open-source nature of the framework ensures transferability beyond Zambia, offering a scalable model for drought-prone regions across sub-Saharan Africa.
The hazard analysis revealed pronounced spatial heterogeneity in drought occurrence across Zambia. Long-term SPI-based frequency mapping identified recurrent drought hotspots in central, eastern, and western regions. Several districts experienced drought conditions in more than 40–60% of the analyzed years, indicating persistent meteorological stress rather than isolated extreme events.
Quantitative hazard maps showed a clear gradient from low-frequency drought zones in northern regions to high-frequency zones in agriculturally intensive districts. The normalization of drought frequency enabled direct comparison across spatial units and supported classification into operational hazard categories relevant for early warning systems.
Source: reliefweb