Broadband Gaps in America
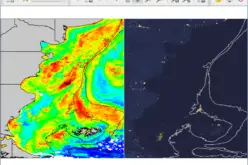
The Connect2Health Task Force’s Mapping Broadband Health in America tool allows users to visualize, overlay and analyze broadband and health data at the national, state and county levels – informing policy prescriptions and investment decisions.
The Mapping Broadband Health in America tool enables data-driven decision-making at the intersection of broadband and health. The map was created to visualize key cross-currents in broadband and health data, as a valuable tool for both public and private stakeholders. By allowing users to ask and answer questions about broadband and health in any county in the United States, the tool provides the data to drive broadband health policies and solutions for this critical space.
The mapping tool can be used in a myriad of ways—by federal, state and local agencies and the private
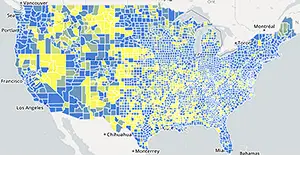
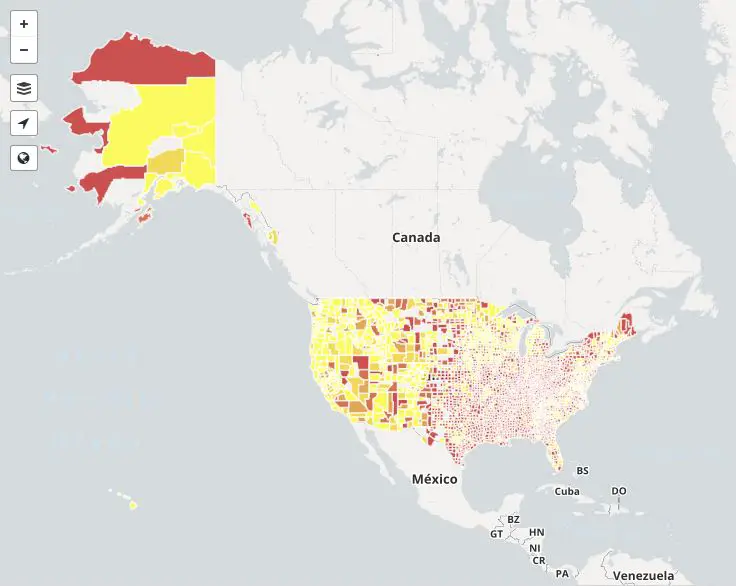
Broadband Health Double Burden Areas
sector. It can help inform policy decisions, facilitate interagency coordination, encourage public/private partnerships and investment, and drive innovation—directing resources to areas with overlapping broadband and health needs.
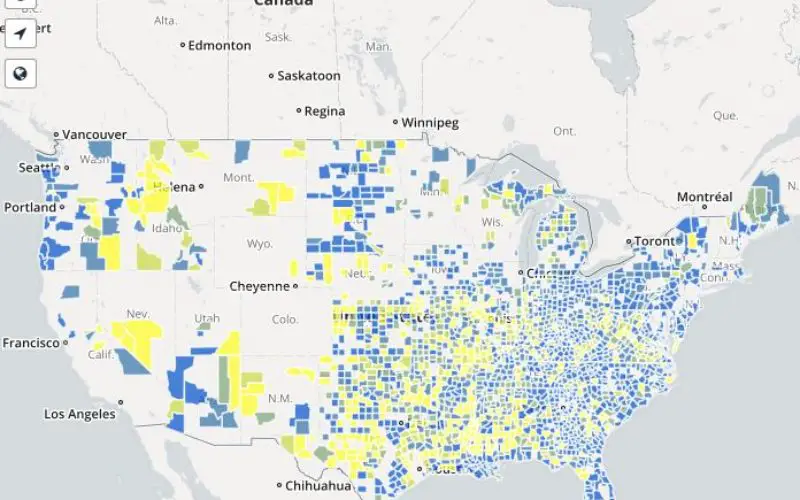
The maps are an interactive experience, showing various pictures of the intersection between connectivity and health for every county in the United States. Users can generate customized maps that show broadband access, adoption and speed alongside various health measures (e.g., obesity, diabetes and physician access) in urban and rural areas.
The Mapping Broadband Health in America tool demonstrates the value proposition of broadband in health and builds on information the Connect2HealthFCC Task Force gathered in our Beyond the Beltway series of events around the country.
Mapping Broadband Health in America
You can explore questions like:
- What is the relationship between connectivity and health?
- What is the chronic disease picture in higher vs. lower connectivity areas?
- Where can existing broadband infrastructure be leveraged now – by policymakers, entrepreneurs, or other stakeholders — to help address physician shortages or high levels of chronic disease?
- Where do infrastructure gaps and poor health outcomes coincide – both at the national and county level – in order to better target and prioritize marketplace solutions and private sector investment?
Key features of these maps:
- Interactive data visualization tools
- Easily accessible statistics about connectivity and health at the national and state levels, to help ground the user experience
- Customizable zoom levels to state, county, or automatic
- Unique URLs created for each customized map to facilitate sharing and collaboration
- Support of open government and open data initiatives through APIs and downloadable data sets
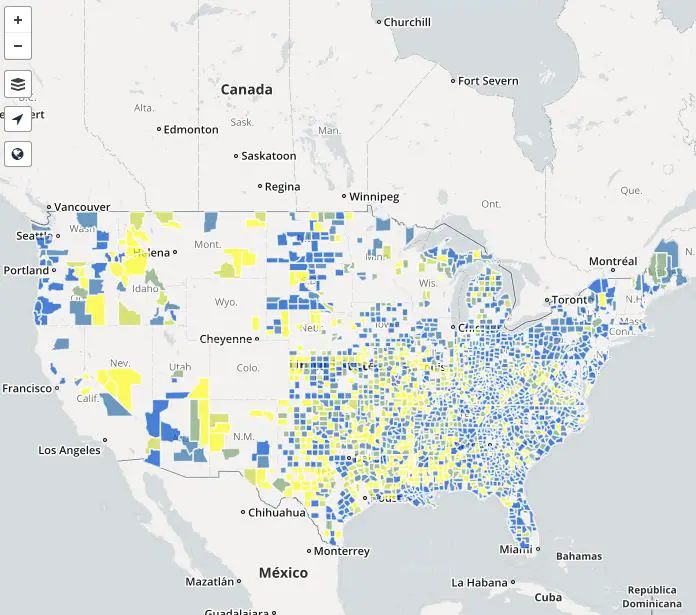
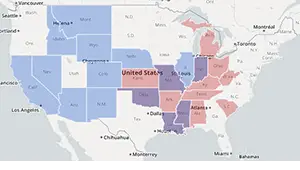
Broadband and Chronic Disease
Potential benefits and uses:
- The maps will be a valuable tool for highlighting areas that might require some special attention. They will also help stakeholders identify the types of collaborations – public/private; network/applications and outreach/education – that may be needed to improve connectivity and health.
- For the FCC and other agencies, the maps can be used to characterize regions, patterns, and gaps to inform policy, regulatory actions or reforms.
- For the private sector, the maps can identify areas where entrepreneurial opportunities for enabling consumer health through broadband exist now.
- And, local communities may find the maps helpful as they allocate resources and focus efforts on leveraging broadband connectivity for health.
- Over time and with periodic data updates, the maps could also be used to assess continued progress in the connected health space.