According to recent news, the National Institute of Oceanography (NIO) is doing a pilot study on environmental sensitivity index (ESI) mapping of oil spill to combat and subsequent formation of tar balls.
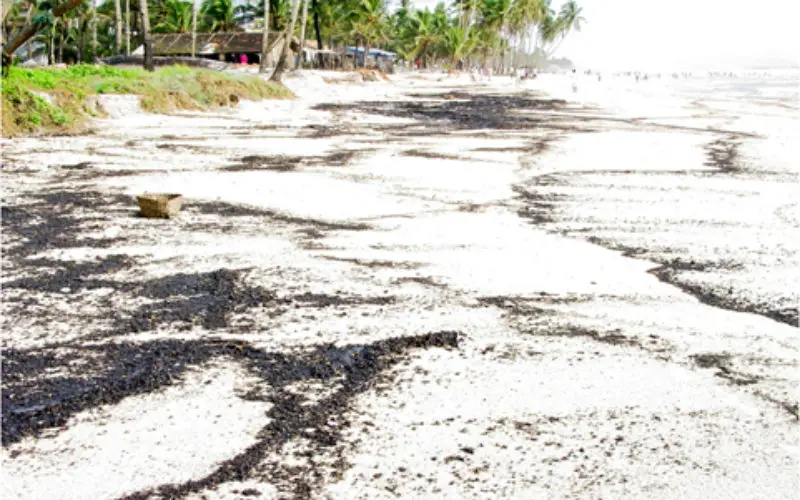
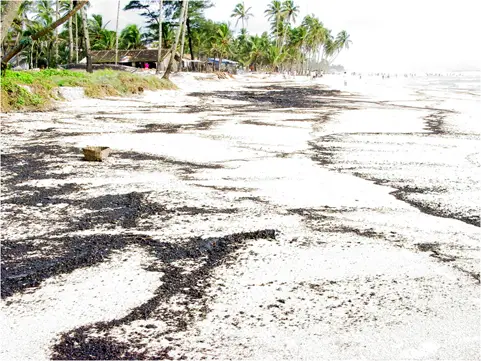
Tarballs along the coast of Goa arise whenever an oil-slick occurs in the vicinity of the coastline. One common cause for such a slick is dumping oil overboard by a passing ship.
ESI is a colour-coded map that shows a shoreline’s vulnerability to an oil spill based on several factors such as sensitivity of the coast, exposure to wave action, slope of sore and biological activity at the coastline.
The study was conducted with the help of GIS and remote sensing technology.
The study by NIO scientists Mani Murali R and Rohan Kumar mapped 7 talukas, starting with the capital city’s, and found that the Tiswadi coastline, with its heavy concentration of mangroves, is the most vulnerable.
ESI map prepared for only seven talukas of Goa.
‘Most vulnerable’ to ‘least’ on NIO’s ESI map:
ESI 10: 700ha of mangroves in Mandovi estuary, 900ha in Zuari estuary
ESI 9: Sheltered tidal flats, vegetated low banks in Mandovi estuary
ESI 8: Sheltered rocky shore in Mormugao port
ESI 7: Exposed tidal flats detected along Mandovi and Zuari estuaries
ESI 6: Gravel beaches; oil percolates which makes cleaning operations problematic (not observed in study area)
ESI 5: Mixed sand and gravel beaches (not observed in study area)
ESI 4: Coarse grained sandy beaches-Miramar, Bambolim, Bogmalo, Velsao, Agonda, Palolem, Talpona, Galgibaga are the major ones
ESI 3: Fine to medium grained sandy beaches. Less penetration of oil and accumulated oil can be driven back from shore by action of tides and waves
ESI 2: Exposed scarps and steep slopes in clay (not observed in study area)
ESI 1: Exposed rocky shores, exposed solid man made structures (very few patches found in study area).
Source: Times of India