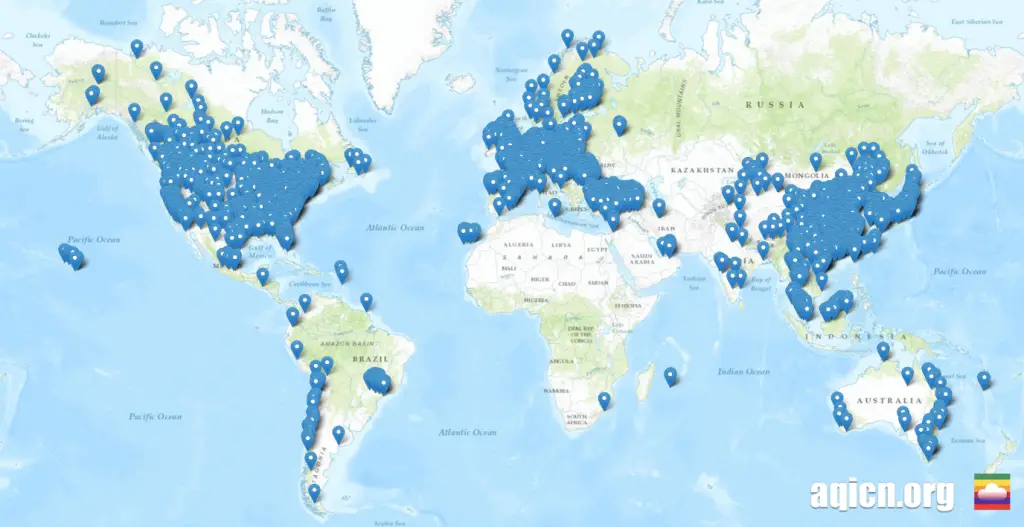
Recently, aqicn.org has published Air Quality mapping information system in real-time for over 70 countries. The data is continuously collected, gathered and processed in real-time from more than 5900 feeds. Only official data feeds from each countries EPA’s and EPB’s is used, i.e. no DIY or amateur monitoring stations data is published on aqicn.
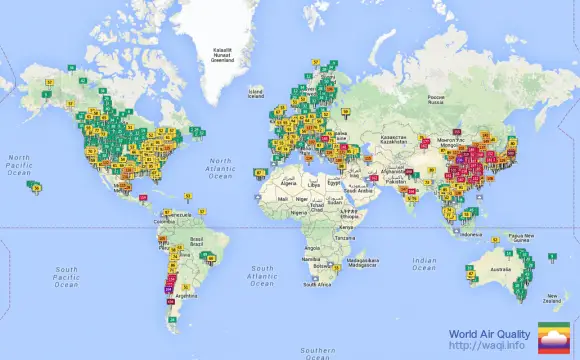
There are currently around than 18900 known monitoring stations, out of which more than 8100 are published. In order to keep a high level on consistency, only stations with particulate matter (PM2.5/PM10) readings are published. The AQI standard for every single published station is based on the US EPA Instant-Cast standard.
The data published on aqicn.org is real-time and therefore unvalidated at the time of publication. However, in order to ensure high level of accuracy for each AQI figures, several machine learning processing solution are used. For instance, data consistency is verified, in real-time, with the neighbour stations, allowing to automatically detect defective monitoring stations, and remove them, if needed, from the map.
aqcin.org is continuously developing and increasing the Air Quality monitoring station coverage, aiming at 10% monthly growth. You can check this page regularly to get the up-to-data data.
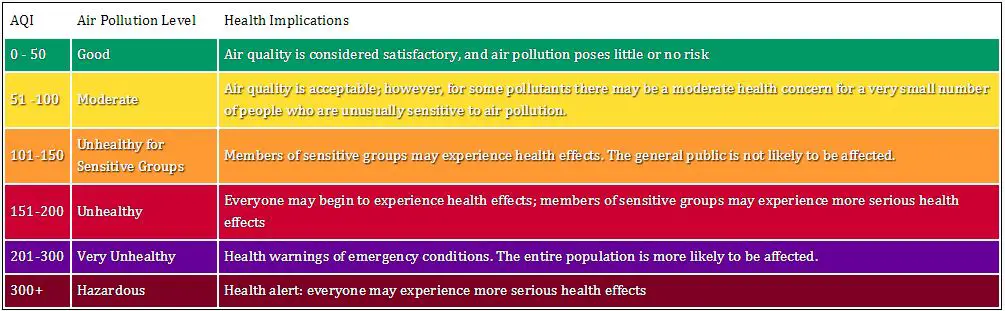
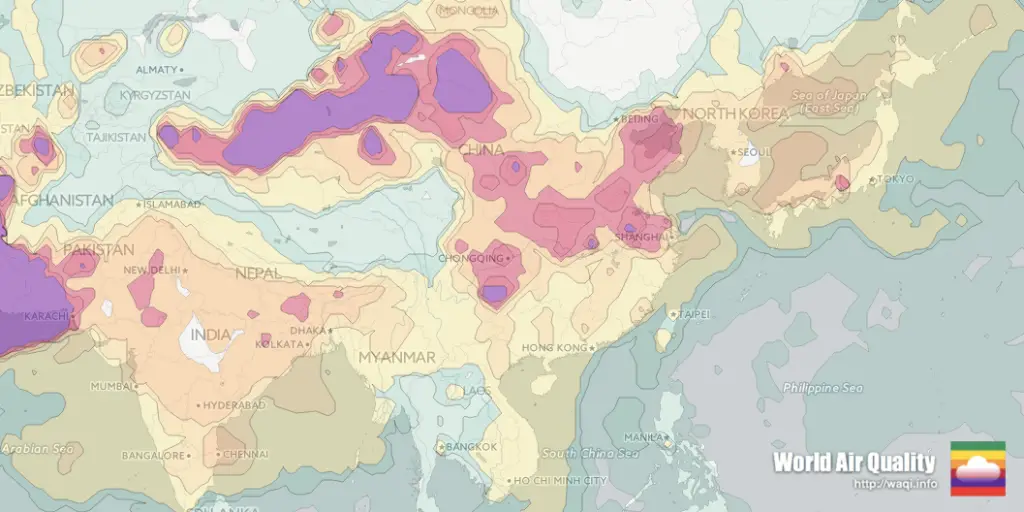
The pollution indices and color codes available on this web site follow the EPA graduation
Publishing data on aqicn.org is free for every one. But it is also simple and straightforward: All you need to add data on the aqicn map is to provide a feed URL with the real-time information about the monitoring stations (name and location), the pollutants being measured and the real-time readings (together with the units, for instance milligrams or ppb).
Note that the data published on aqicn.org (see aqicn.org/map/world) is only official data provided by each country respective EPA (Environmental Protection Agency).