Solar Induced Chlorophyll Fluorescence – A Better Predictor of Crop Stress through Satellite Remote Sensing

Remote sensing for crop health monitoring and management
Remote sensing has proven to be an efficient crop monitoring technology relating to various crops’ biophysical and biochemical conditions and diseases. The various methods which utilize spectral responses, spectral indices, and machine learning integrated with field data demonstrated their strength and scope for crop stress identification.
Since the spectral index and spectral response curves are more related to the biochemical properties of crops, present-day research attempts to incorporate information of biophysical changes. The question on what parameter from remote sensing platform can connect to molecular level photosynthetic activities direct towards the Solar Induced Chlorophyll Fluorescence parameter.
This article mainly focuses on the traditional method of understanding crop stress and diseases and how the Solar Induced Chlorophyll Fluorescence information can further improve these methods for better crop management.
Overview of traditional methods
Satellite remote sensing techniques are often used for crop disease identification due to their synoptic coverage, repetitively and non-destructive way of analysis. The basis of these methods lies in the appropriate identification of relationships between the fluctuation of the spectral reflectance curve and plant stress.
Spectral reflectance-based methods are referred to as traditional methods in this article only because that these methods have already undergone numerous revisions and improvements to their greater extent.
From a ‘crop disease management’ point of view, leaf scale or plant scale information is often desirable for better disease identification.
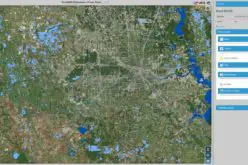
The medium resolution satellites like Landsat, Sentinel 2 etc., provide extremely smooth spectral response curves, which are not at leaf/plant scale. These data sets are often used for analyzing plant stress due to extremities like drought or waterlogging situations. Hence the utility of these medium resolution satellite data in crop disease identification is limited.
Since the sensitivity of crop dynamics lie in the NIR and red electromagnetic spectrum, more spectral subdivisions in these regions were provided in recent multispectral remote sensing sensors. The addition of many red edge bands in Sentinel 2 is the step towards this goal.
The utility of hyperspectral data and its effectiveness compared to multispectral data is demonstrated in various applications. High sensitivity to spectral changes of the crop could help to detect diseases. The large volume of data and unavailability of enough satellites makes this method unadaptable for day-to-day crop monitoring.
UAVs with hyperspectral radiometers are often used at the farm level, which adds to their efficiency due to the minimum atmospheric disturbances. Rather than looking into individual spectrum changes, the spectrum combinations or indices could better relate to infected crops’ biochemical processes.
But in most crops, the disease specificity is difficult to achieve when spectral changes vary with local conditions. It is not easy to generalize the information through a standard curve for crops. In such cases, careful feature selection from spectral bands backed by field data and optimal choice of ML algorithm could provide better outputs when hyperspectral data is unavailable.
Machine learning algorithms have greater power when dealing with a large amount of ‘quality’ data. ML has been applied in many crop monitoring applications and has become a powerful tool for Agri entrepreneurs doing business in the precision farming sector.
ML algorithms learn the intrinsic (linear and nonlinear ) relationships between the independent factors and crop health and classify or predict them without relying on specific crop parameters. Artificial neural networks (ANN), Support vector machines (SVM), tree-based ML models etc. (Random forests, decision trees, Extreme gradient boost etc.) are successfully applied in many research and commercial applications. These models are feature extraction-based models where the input features to the ML algorithms are manually extracted or manually feature engineered.
Also, read – Geospatial Technologies for Crop Damage and Compensation Estimation
When it comes to deep learning, automatic feature engineering is implemented, and the outputs are more reliable than ML techniques. Agricultural remote sensing coupled with ML applications utilize large volume of input data from the field and image.
Aligning the field data collection with the satellite overpass is subjected to clear weather conditions. The spatial scale of satellite data becomes another challenge while establishing mathematical relationships with field and satellite data.
When we use satellite data for crop management, many fundamental questions are often unanswered, like which satellite data to be used? Optical data or SAR data? How many bands are to be included? Are the same features applicable to different crops? How much information is needed for running a particular model?
The answers to these questions in a multivariate complex agricultural system are not easily available. Ignoring the answers to these questions and simple generalizations may often lead to undesirable results.
What is Solar Induced Chlorophyll Fluorescence
All methods mentioned above are spectral reflectance-based methods that are dogged by sensor characteristics and resolutions. The noise of the data is remarkably high and depend on field conditions. Moreover, spectral information is not much related to the biophysical state of the crop.
The Solar Induced Chlorophyll Fluorescence – based crop monitoring method mostly addresses crop physiological changes. This method delivers information to the user from a perspective relating to the crop’s biophysical activities than biochemical changes.
Solar Induced Chlorophyll Fluorescence is an electromagnetic signal re-emitted by Chlorophyll-a of a plant which was absorbed by chlorophyll-a and chlorophyll-b from active photosynthetic radiation but unused for photosynthesis. Fluorescence is a special technique used by plants to dissipate their energy from photosynthetically absorbed radiation.
This interesting phenomenon was discovered by Sir David Brewster, a Scottish scientist, almost a century ago and new in remote sensing applications due to the unavailability of sensors that pick these weak signals.
It is emitted at 650-850 nm spectral ranges and only a negligible percentage (0.5%) of the radiance from the plant canopy. It requires sensors with a high spectral resolution which often leads to capturing larger noises.
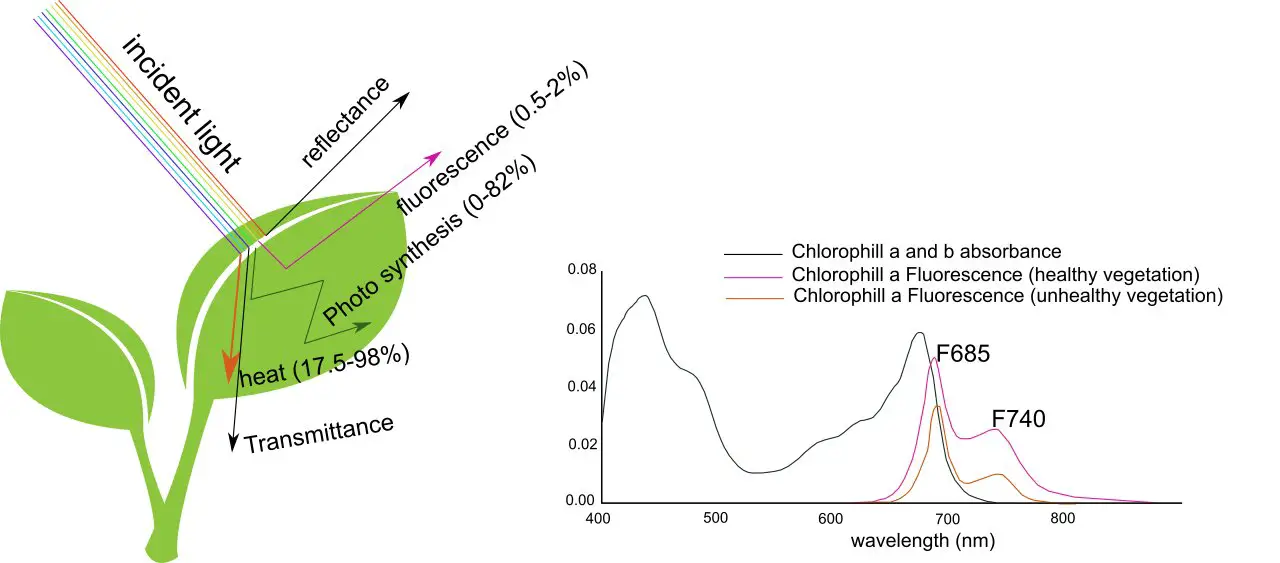
The emissions generally happen from chlorophyll-a at two spectral regions (685-695 nm and 730-740 nm), and it slightly covers the visible region of the electromagnetic spectrum.
These two regions are named F685 and F740, respectively (refer to Figure 1) and are difficult to be captured by human vision. Since the emissions are proportional to the photosynthetic activity of the vegetation, it is considered as a linear proxy to photosynthesis.
In remote sensing-based studies, photosynthetic activity is indirectly estimated by NDVI values. The NDVI like indices are more influenced by visible changes and are saturated at higher values. It cannot provide information about how efficiently light is used for photosynthesis.
How Solar Induced Chlorophyll Fluorescence is different than Traditional Method
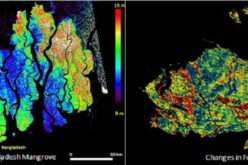
Since the Solar Induced Chlorophyll Fluorescence (SIF) is more related to physiological processes inside the plant, it is a good indicator of drought and diseases-induced stress. The SIF is considered as a ‘photosynthesis index’ and not a ‘greenness’ index like NDVI.
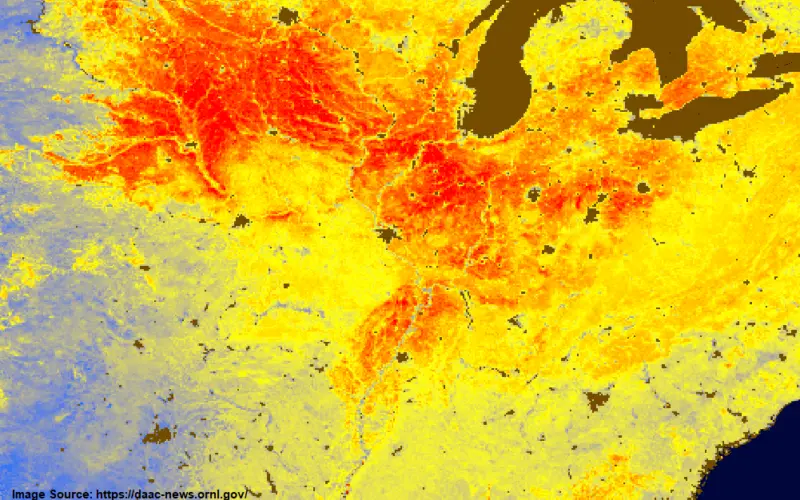
Healthy vegetation generally emits more fluorescence compared to unhealthy vegetation. Therefore the diminished fluorescence directly indicates the decline of crops’ physiological activities. The fluorescence may not always fluctuate along with the crop’s greenness. For example, irrespective of high NDVI for forests, the SIF will be less than agricultural areas. It means that healthy agricultural fields glow better than unhealthy fields and forests.
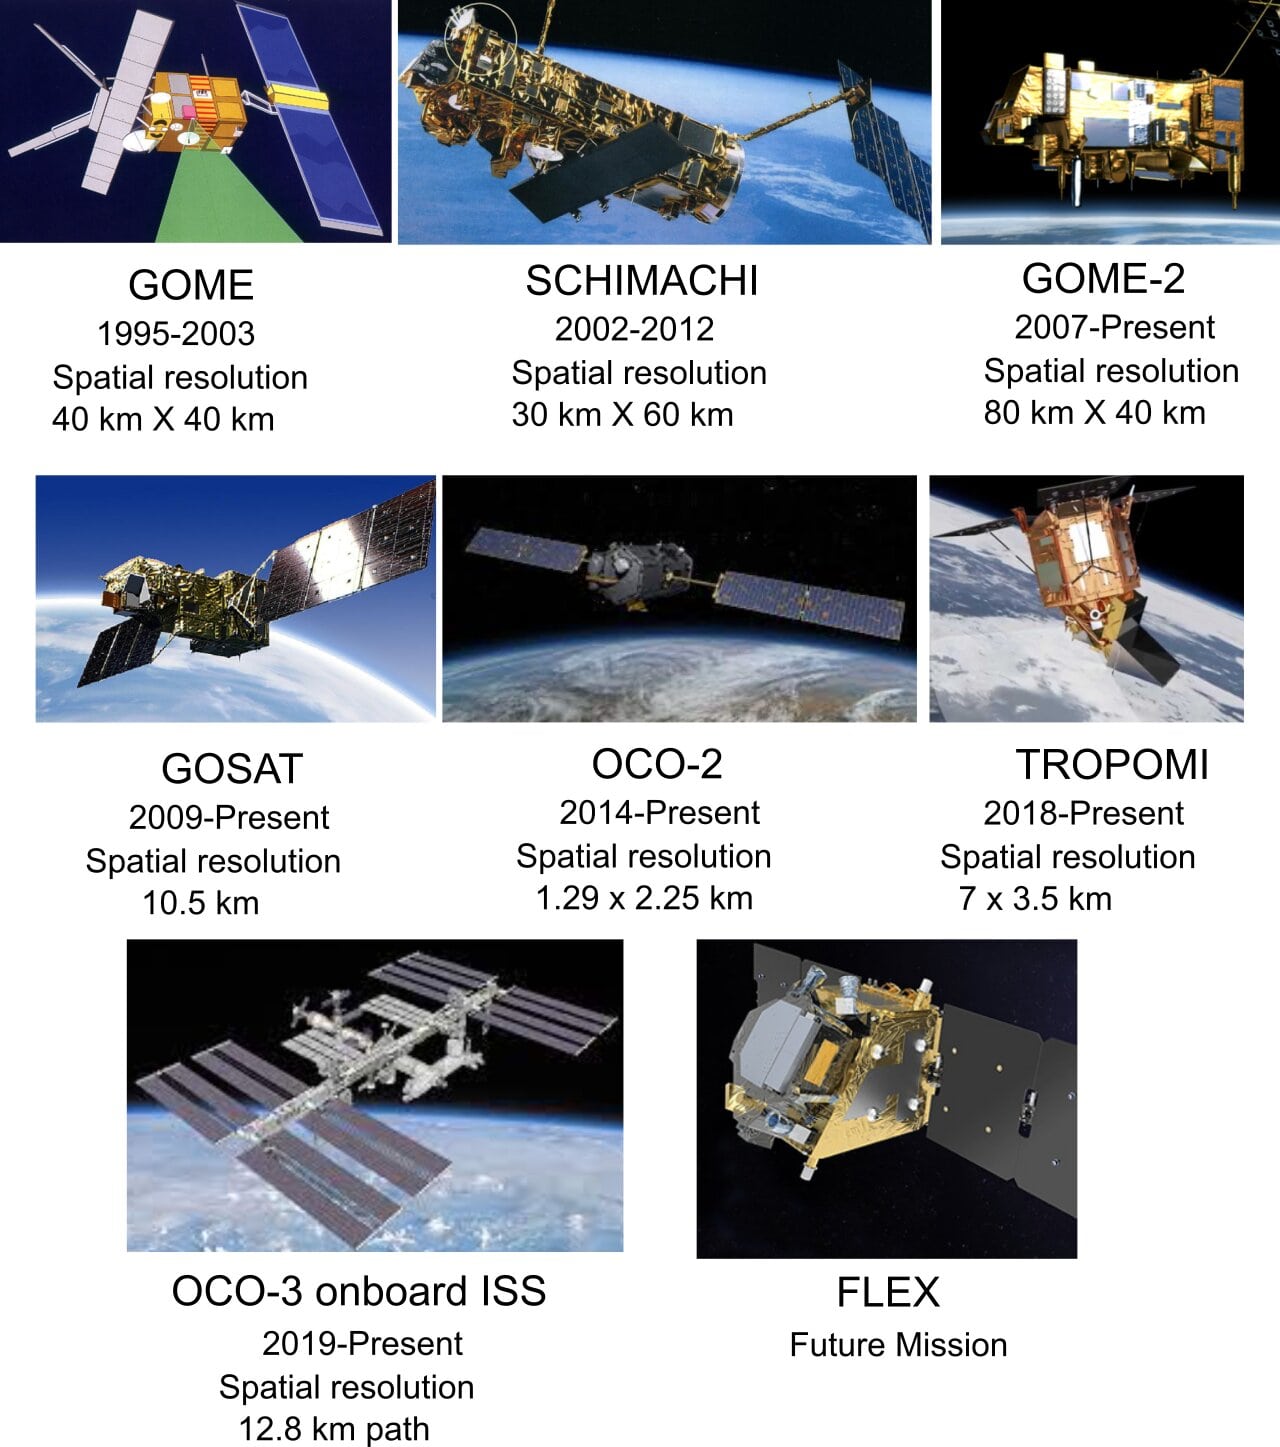
Japan’s Greenhouse Gases Observing Satellite (GOSAT) was the first mission to assess the utility of SIF for vegetation monitoring from space. It captured fluorescent signals globally with a very coarse spatial resolution. OCO-2 is another mission that retrieved SIF measurements in spatial resolution of 2 km. It was not a global scanning mission, and was used for small experimental patches near Chicago.
Also, read – An Insight to NDVI
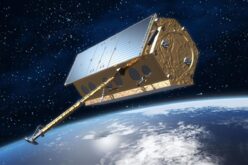
Sentinel 5P mission has recently demonstrated the SIF data captured by the TROPOspheric Monitoring Instrument (TROPOMI) onboard. The data from TROPOMI is not fully dedicated to the SIF measurement of vegetation. The Fluorescence Explorer (FLEX) mission is ESA’s fully dedicated SIF mission expected to be launched in 2025. It is designed to fly tandem with Sentinel 3 mission. The FLEX is a high-resolution mission that will acquire data in 500-780 nm. Various SIF missions and their specifications are shown in Figure 2.
The presently available SIF data sets are of coarse spatial resolution and are not useful for any field scale estimations. Since vegetation indices are not much sensitive to the biophysical activity of a crop, SIF may provide additional information for better crop management. SIF related research is still in infancy, and its correlation with photosynthetic activity is not fully understood. Currently, the data acquired are noisy, and techniques are to be improved to eliminate heavy data noises.
Remark
In this article, the authors clearly state that the SIF is not the replaceable solution for spectral curve-based crop management. It is always a piece of additional and critical information to be used along with spectral or structural data. The synergy is the better option rather than the sole utilization of SIF for crop monitoring and management perspective.
*This article originally published in the GIS Resources Magazine