
Pointly’s approach to an AI-supported conduction of a forest mapping and inventory
It’s probably nothing new that due to technological advances in recent years both aerial and terrestrial LiDAR surveys have become widely used to map entire forests and extract needed information. Modern sensors can emit millions of pulses per second and are able to collect point cloud data with very high point densities. With state-of-the-art cloud solutions and high-performance computing, large amounts of gathered 3D data can be processed and stored. Nevertheless, there is still a lot of labor-intensive manual work when it comes to the analysis of forest surveys from LiDAR sources, e.g. to determine single tree instances and to extract further inventory information like the number of trees, their canopy shapes, heights, or diameters. The unordered structure of the point clouds makes it challenging to process these large amounts of data algorithmically.
Pointly’s specialized team of data scientists developed a universal approach to automatically conduct forest inventories with the help of AI and smart algorithms. The approach helps to minimize human error, reduces costs a lot, and speeds up the process to give insights faster.
Pointly is a company based in Germany and has specialized in AI solutions for 3D point clouds. They offer a SaaS platform, also called Pointly, for fast and user-friendly manual 3D point cloud classification. In addition to the manual classification tools, the platform will offer automated classification features and options to train your own neural network soon. Complementing the classification platform, Pointly also offers Services regarding 3D point cloud analysis. Here customers can get tailormade AI solutions with full support from proof of concept to highly scalable applications.
Forest Inventories
A forest inventory is the gathering of information on the health and diversity of a community forest. It can provide details such as tree condition, species, size and location.
A forest inventory can serve many different purposes:
- Identify insect or disease problems of trees
- Better isolate the causes of changes in the landscape through monitoring changes over time
- Help urban planners to develop maintenance and management plans
- Analyze and optimize the environmental impact of trees as a part of sustainable forest
management - Inform the residents about their community forests
- Determine the value of community trees regarding increasing property values
- Visually assess timber and determine potential fire hazards and the risk of fire
What’s necessary for that?
Point clouds are a complex data type to work with. They are computational-heavy, require lots of storage and high bandwidth. Often, they are used for large-scale or in-depth analysis to obtain valuable information about contained objects and spatial properties. The results are typically other data-products like a shapefile, vectors, simplified 3D models, or even a csv containing information about certain objects in the point cloud.
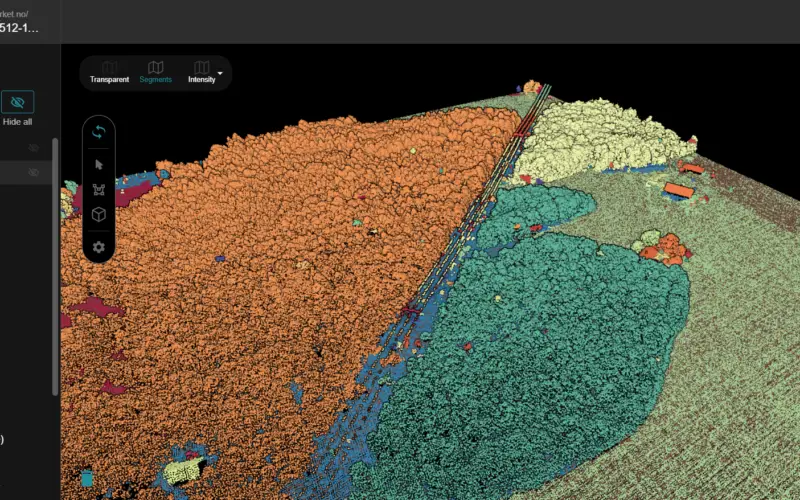
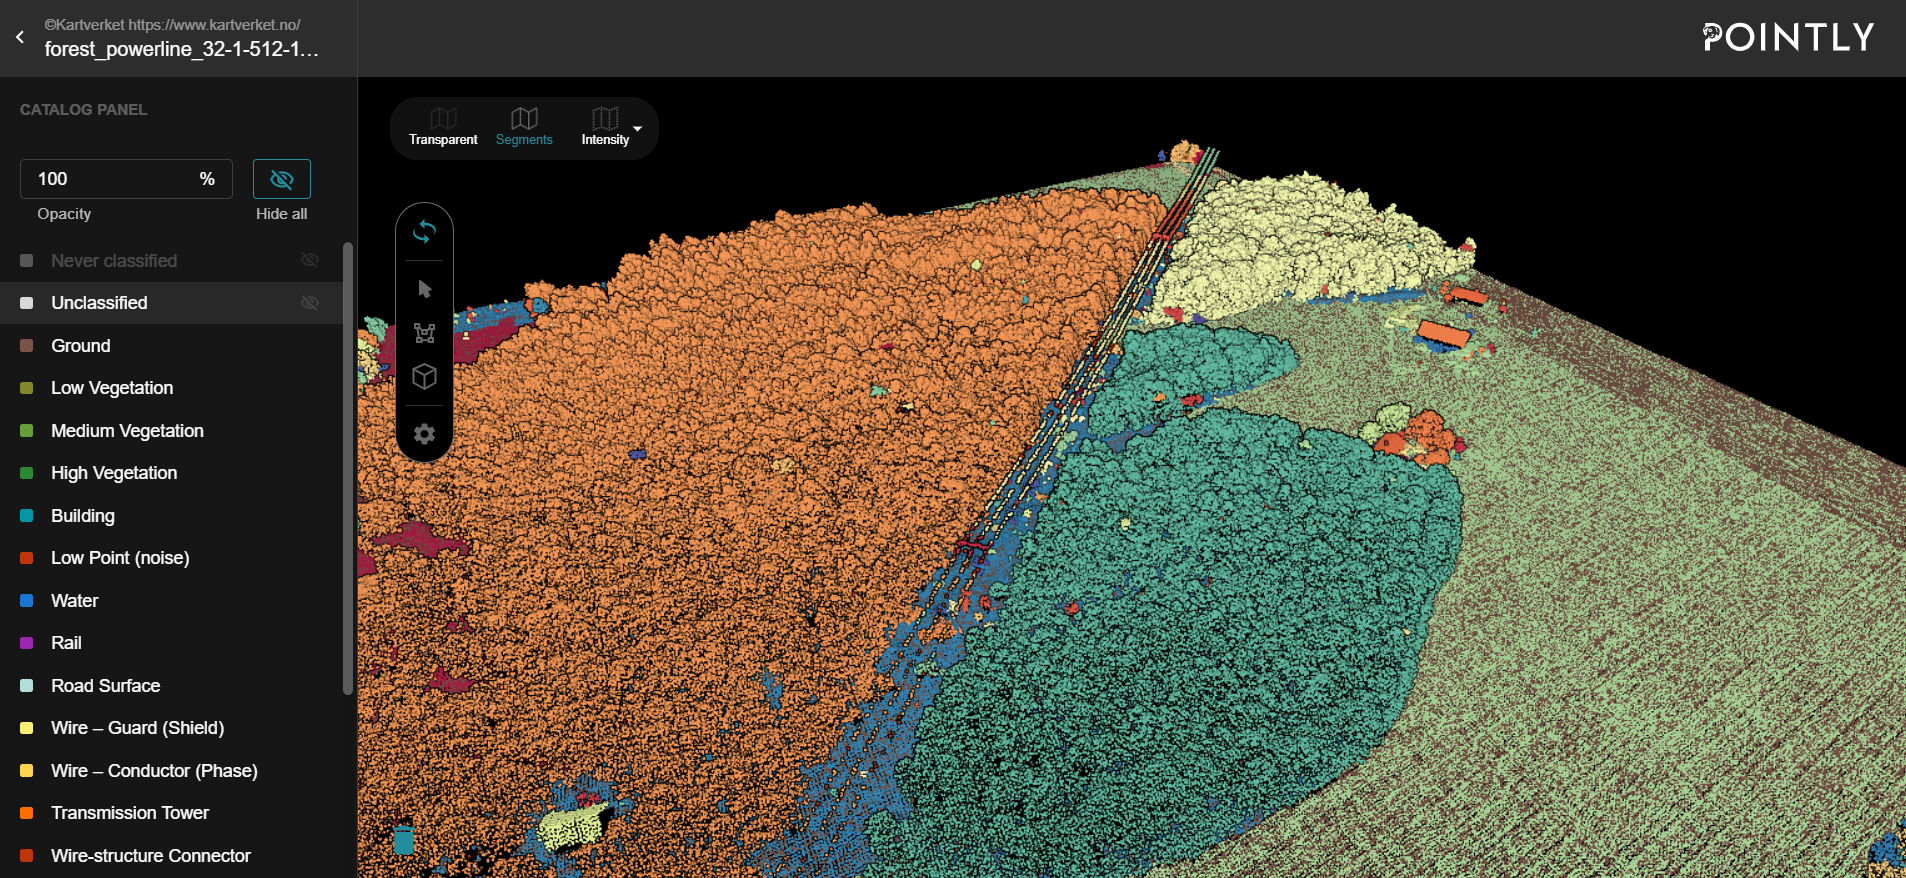
To automate the analysis of those datasets it is beneficial to classify the point clouds first. Pointly enables its users to efficiently manually classify even very large point clouds with the help of easy-to-use selection tools to generate customized training data. One of those tools is for example the Segment Selector, where users can classify whole areas with one click as you can see in the image below. These segments are pre-calculated based on the existing point cloud dimensions and other geo-features.
This training data is used to train the AI model to automate the classification of the point clouds.
Sid Hinrichs (Strategy, Sales and Finance at Pointly) says as a rule of thumb “the better the quality of the training data and the more you have, the more robust can the AI model become”. A robust model means that the automatic classification of new point clouds reaches high accuracies. Depending on the use case the model must be tweaked to reduce either the number of false-positive or false-negative errors for certain object classes.
“The quality and quantity of training data is the crux of the matter for the success of the AI application.”
“Though, it’s hard to say how much data you exactly need and how good the quality of the raw data needs to be. That always depends on the complexity of the use case. We usually evaluate this on a first sample dataset with our customers and define their exact requirements to figure out what’s necessary and possible with our approaches”
Sid Hinrichs
Challenges of Pointly’s approach in forestry mapping
LiDAR point clouds of trees can be extremely diverse depending on the applied acquisition method (e.g. airborne or terrestrial LiDAR scanning). That is why one of the biggest challenges was to develop algorithms based as little as possible on the specific characteristics of the different scans, so that they could be used universally. Those differences could be:
- Flight altitude
- Density of the point cloud
- Time of flight (e.g. winter or summer)
- What was measured (some scanners measure partial reflections of the laser, some don’t, sometimes intensity is part of it or not)
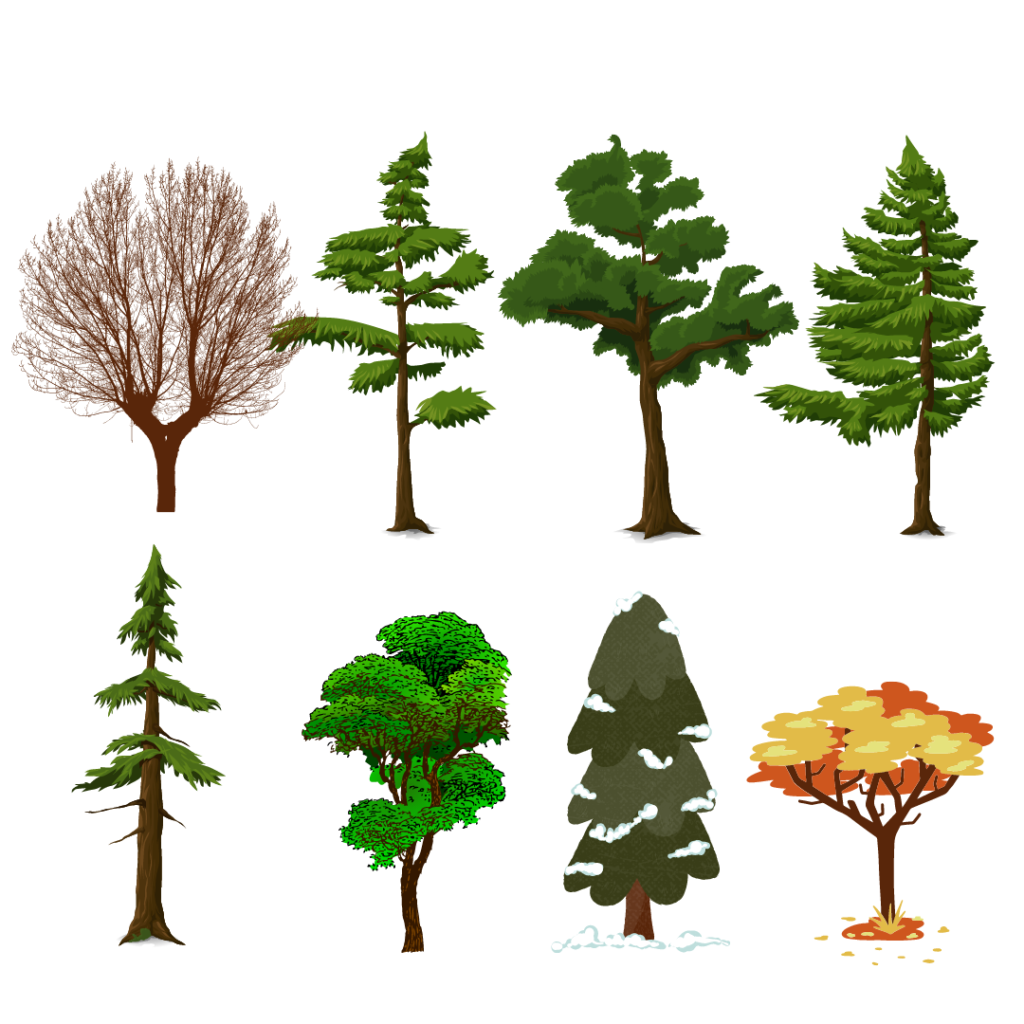
Another factor is that trees are very diverse themselves and can have different dimensions on different parts of the world. Even the time of the year where the scan was performed is an important factor to consider. The same tree can look very different between summer and winter. Developing universal approaches required testing and adjusting different methods like watershed separation or region growing from detected tree stems.
Implementation
The Pointly team developed a processing pipeline, that takes point clouds as input and outputs a shapefile with the location and metadata of single trees. The pipeline combines deep learning and different smart algorithms to identify tree points and separate individual trees from above, both with visible tree trunks and without.
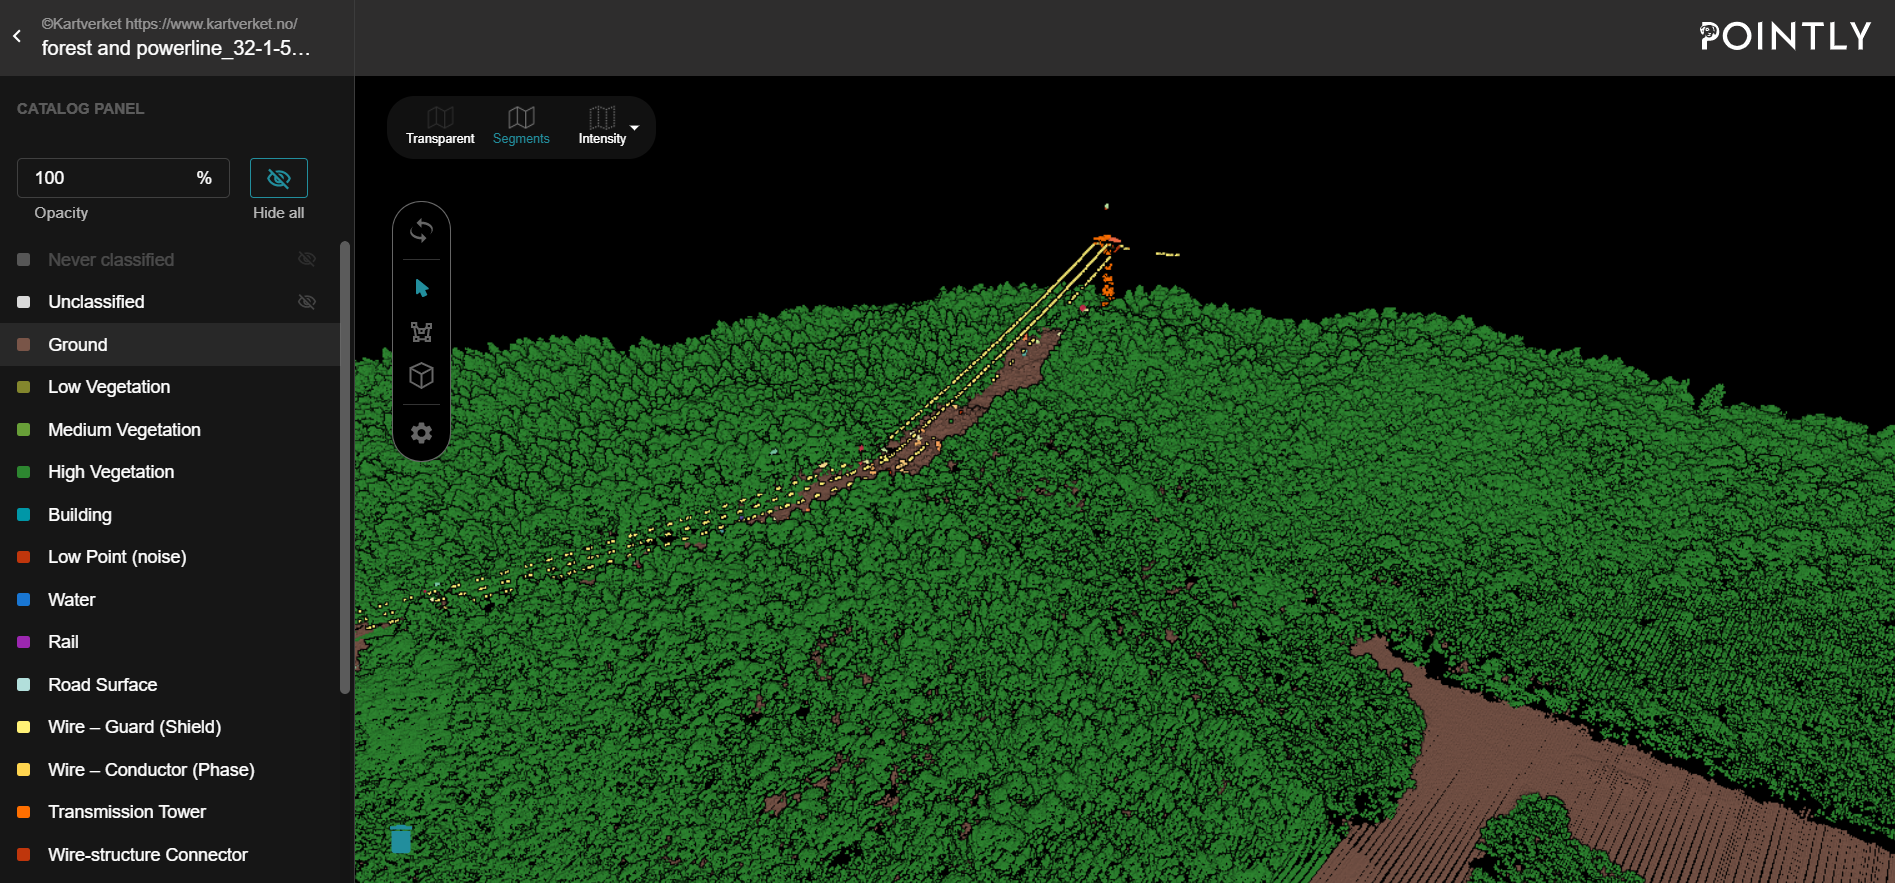
Initially, the vegetation and other classes like Ground, Buildings, Low + High Vegetation, Power Lines, Poles, and Vehicles were classified manually to generate a comprehensive set of training data for training a neural network. However, by the use of the Pointly Platform and its easy-to-use selection tools this task could be performed in just a few days of effort. Using the neural network, the classification can be fully automated. Additional point cloud dimensions such as Intensity values or the number of returns from the LiDAR scanner are important features for this classification step.
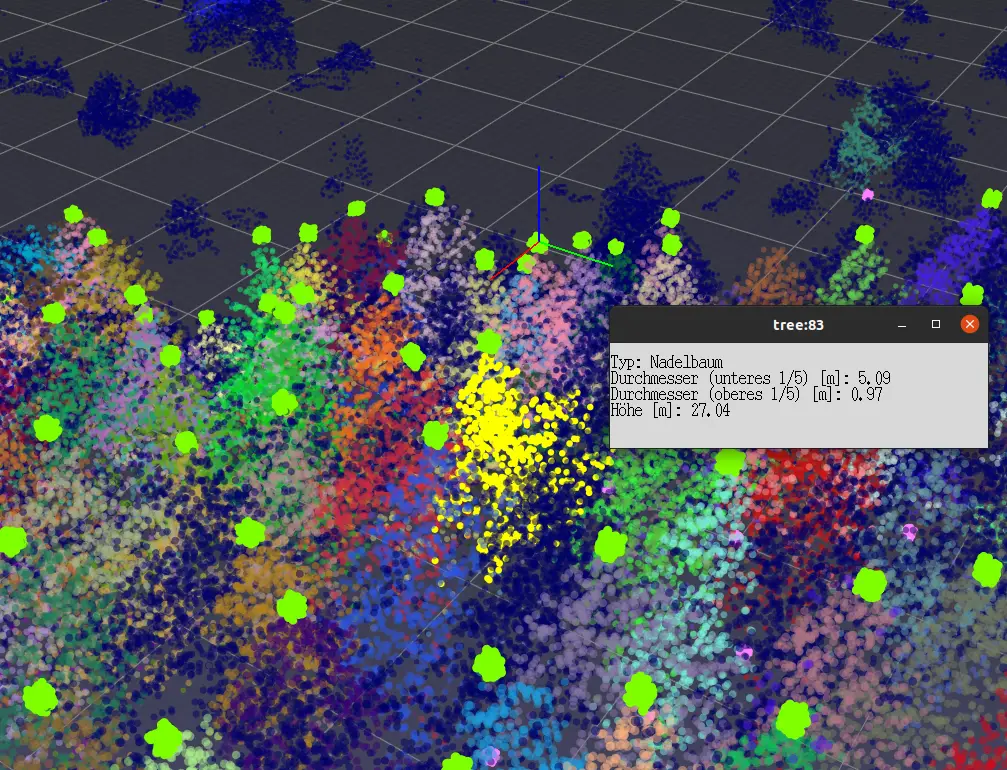
Using the classification, all points including high vegetation can be then extracted and all remaining points are filtered out. To determine the single tree instances from the high vegetation points some additional processing steps need to be performed. These steps for the instance segmentation are traditional GIS methodologies that need to be adopted to work optimally on the present dataset. To reach the desired results, a combination of tree features such as crown maxima, tree stump positions, and more geospatial algorithms is used. Stump position and height can be determined for each tree segment, whereas the crown extent is determined by means of 2D projection.
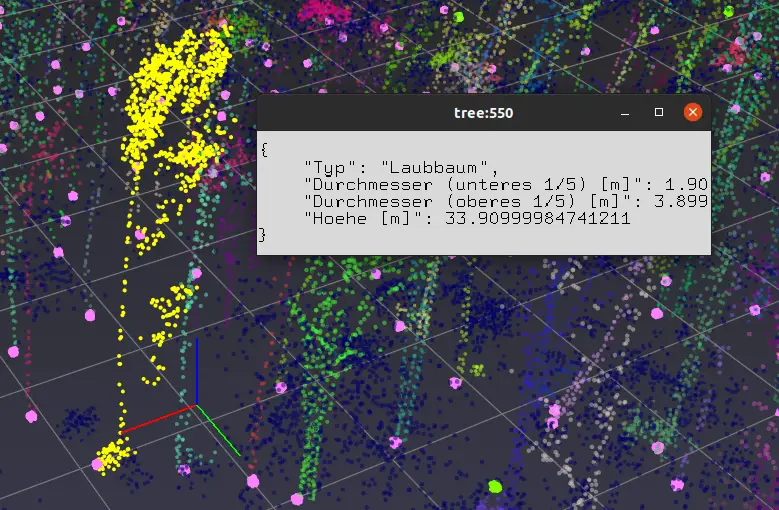
Afterwards, the results of classification and instance segmentation can be transferred into other common geodata types (i.e. GeoJSON, Esri shapefile) and are enriched with additional information such as height attributes and diameters.
Possible Results
Pointly’s goal is to enable a more efficient forest inventory to provide exact tree point identification in the point cloud as well as individual tree separation with corresponding inventory data such as object-ID, exact position, height, or crown’s extent as a result. The actual output and analysis per object can be extended or adapted from case to case. With the applied approaches it is also possible to differentiate between deciduous and coniferous trees.
Conducted inventories can be delivered as a map layer, including tree counts, canopy shapes as well as tree heights and additional metrics. The generated outputs can be further adapted to the client’s needs and for example be provided as a CSV or condensed to a report. The actual classified point cloud, including information about the tree instances can be delivered as well. The point cloud data can become quite large but can be useful for further analysis or visualization purposes.
If you are interested in getting your own automated forest inventory with the help of Pointly or have other Use Cases considering trees (like change detection or evaluations of the health of the trees, risk analysis, etc.) you can get in contact with Pointly via www.pointly.ai or email to info@pointly.ai.
*This article was originally published in GIS Resources magazine, December 2021 issue. The magazine can be read here.
Also Read
Remote Sensing and GIS for Sustainable Forest Management