

Hepatitis B virus (HBV) infection remains a significant public health concern in China, a country with one of the highest burdens of this disease worldwide. Despite ongoing efforts to control the spread, HBV remains endemic, particularly in certain high-risk regions. To effectively address this issue, Spatial-Temporal Data Analysis to Reveal Hepatitis B Patterns is crucial.
This analysis provides a clear understanding of how the infection spreads over time and across different regions, offering evidence-based insights necessary for developing targeted and actionable public health strategies. By focusing on these patterns, we can enhance our approach to controlling HBV and mitigating its impact in the most affected areas
This comprehensive study (by Jiao, L., Shen, T., Han, Y. et al*) leverages advanced spatial-temporal GIS techniques to analyze HBV infection patterns in China from 2006 to 2018, with the objective of identifying high-risk areas and trends that can guide targeted interventions.
Background
Hepatitis B is a viral infection that can lead to chronic liver disease, cirrhosis, and liver cancer. Despite the availability of a vaccine, HBV continues to be endemic in China, with significant variations in infection rates across different regions. Prior studies have offered fragmented insights, but few have conducted an in-depth, long-term spatial-temporal analysis of HBV distribution.
This study addresses this gap by applying advanced statistical methods to assess how HBV infections have spread and varied across China over 13 years. By integrating GIS technology with epidemiological data, this research provides a more nuanced understanding of the factors driving HBV prevalence.
Materials and Methods
The study utilized data from the National Notifiable Disease Reporting System, which documented HBV cases across China between 2006 and 2018. The dataset encompassed millions of reported cases, providing detailed information on patient demographics, location, and time of diagnosis.
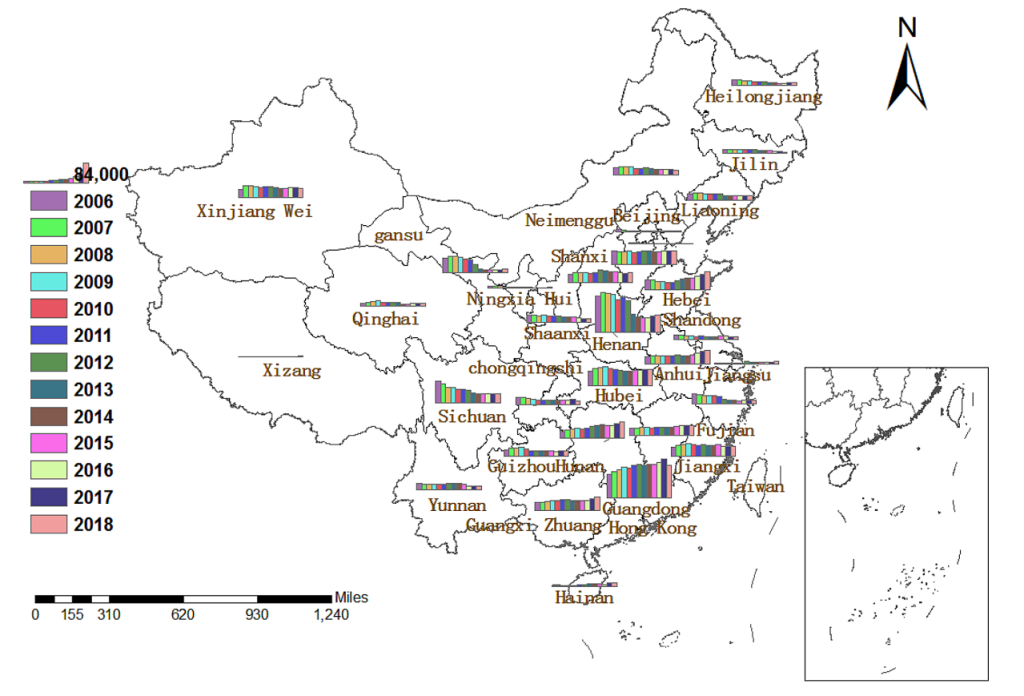
1. Trend Analysis of Different Project Segments
The analysis categorized data into five segments: provinces with incidence rates over 100/100,000 annually, seasons, age groups, geographic regions, and hepatitis B case dynamics from 2006 to 2018. The study tracked incidence rates across these categories to observe trends.
Through rigorous trend analysis, the study identified key periods of increased infection rates, correlating them with public health interventions and external factors such as vaccination campaigns. Seasonal patterns, age group distributions, regional differences, and case growth dynamics were analyzed using statistical methods, with trends plotted over time.
This allowed for a more targeted approach to understanding HBV’s epidemiological behaviour across various demographics and regions in China.
2. Spatial Autocorrelation Analysis
Spatial autocorrelation was analyzed using the Moran’s I statistic, which measures the degree of clustering of similar infection rates across the study area. A high positive Moran’s I value indicated that HBV cases were geographically clustered, while a negative value suggested a dispersed pattern.
The study’s use of Moran’s I and spatial weight matrices provided critical insights into the geographic clustering of HBV cases, revealing both broad and localized patterns of infection. By creating a spatial weight matrix based on inverse distance, the researchers assessed both global and local Moran’s I indices to identify clustering patterns.
This dual-level analysis highlighted areas of significant spatial dependency, offering a detailed perspective on how HBV infections spread across different regions.
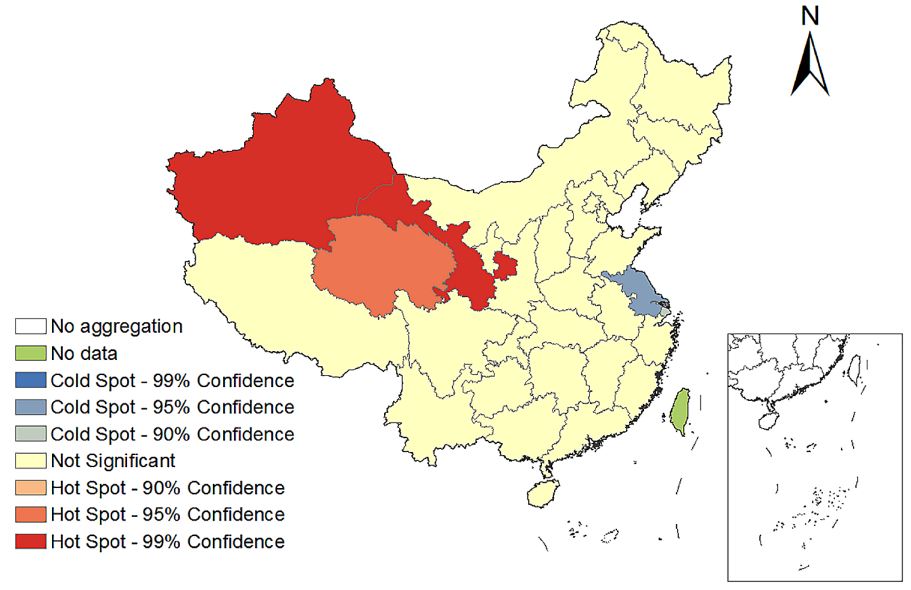
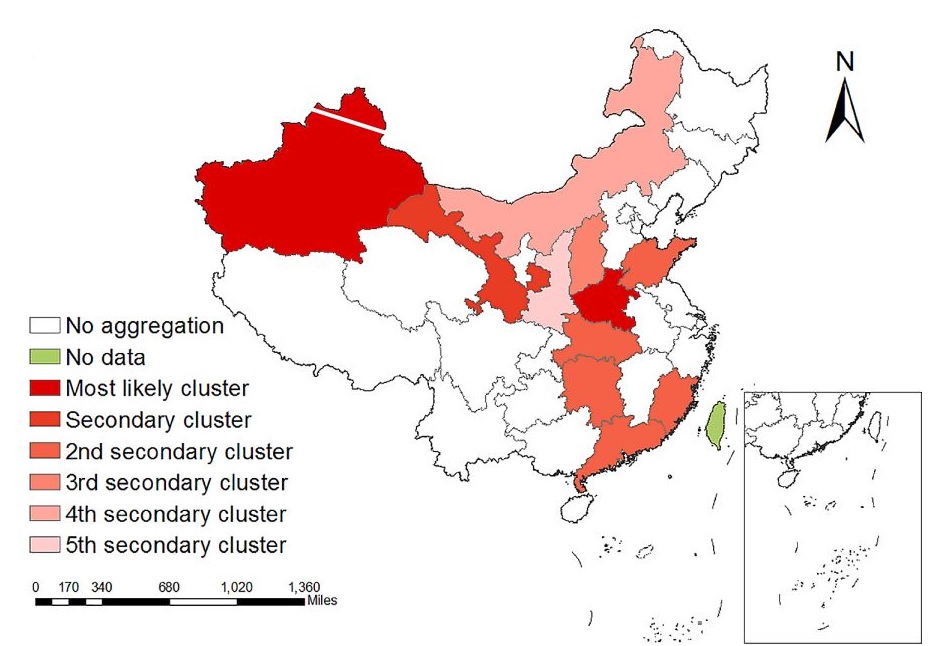
3. Spatial Clustering Analysis
The study utilized Moran’s I and Z-score tests to assess the spatial clustering of hepatitis B across China from 2006 to 2018, considering P<0.05 as statistically significant. This rigorous statistical approach ensured the reliability and validity of the clustering results, which were further refined using advanced spatial analysis tools.
Local Moran’s I was employed to address limitations of global analysis, classifying clusters into four types: high-high (HH, indicating hotspots), high-low (HL), low-high (LH), and low-low (LL). The use of SaTScan software and log-likelihood ratios (LLR) further strengthened the analysis, allowing for the precise identification of high-risk clusters.
Additionally, ArcGIS 10.2 software was used to visualize the spatial distribution of hepatitis B incidence rates from 2008 to 2018, with darker shades indicating higher rates.
The combination of these tools provided a comprehensive visual and statistical representation of HBV hotspots, essential for guiding public health interventions.
Also Read – Karnataka State Health Department Launches GIS App to Help Accident Victims
Results of Spatial-Temporal Data Analysis to Reveal Hepatitis B Patterns
Spatial-Temporal Data Analysis to Reveal Hepatitis B Patterns uncovered considerable variability in HBV infection rates across different regions of China. Certain provinces, particularly in the western and southern parts of the country, consistently exhibited higher infection rates. These findings underscore the importance of region-specific public health strategies, particularly in high-risk zones where HBV transmission remains a significant challenge.
The trend analysis showed a general decline in HBV incidence across most segments, likely due to the nationwide implementation of HBV vaccination programs. However, the decline was not uniform, with some areas showing persistent or increasing rates of infection, particularly in rural and remote regions. These disparities highlight the ongoing need for targeted interventions in under-served areas, where healthcare access may be limited.
Spatial autocorrelation analysis confirmed the existence of significant clustering of HBV cases, with Moran’s I values indicating strong spatial dependency. The spatial clustering analysis further identified several persistent high-risk clusters, particularly in rural and economically disadvantaged regions. These clusters represent critical areas for continued surveillance and intervention to prevent further transmission.
Conclusion
This study provides a detailed examination of the spatial-temporal distribution of HBV infection in China from 2006 to 2018. The findings highlight significant regional disparities in HBV prevalence and trends, underscoring the need for region-specific prevention and control strategies.
By leveraging advanced GIS and spatial-temporal data analysis to reveal Hepatitis B patterns, the study offers authoritative insights into the epidemiology of HBV in China, identifying high-risk areas that should be prioritized for targeted public health interventions.
Ongoing surveillance, coupled with tailored public health efforts, is essential to reducing the burden of HBV and improving health outcomes in the most affected regions.
*Reference: The spatial-temporal distribution of hepatitis B virus infection in China,2006–2018 by Liping Jiao et. al.